Free Top 20 U.S. States by Personal Loan Growth (2015-2025) Chart
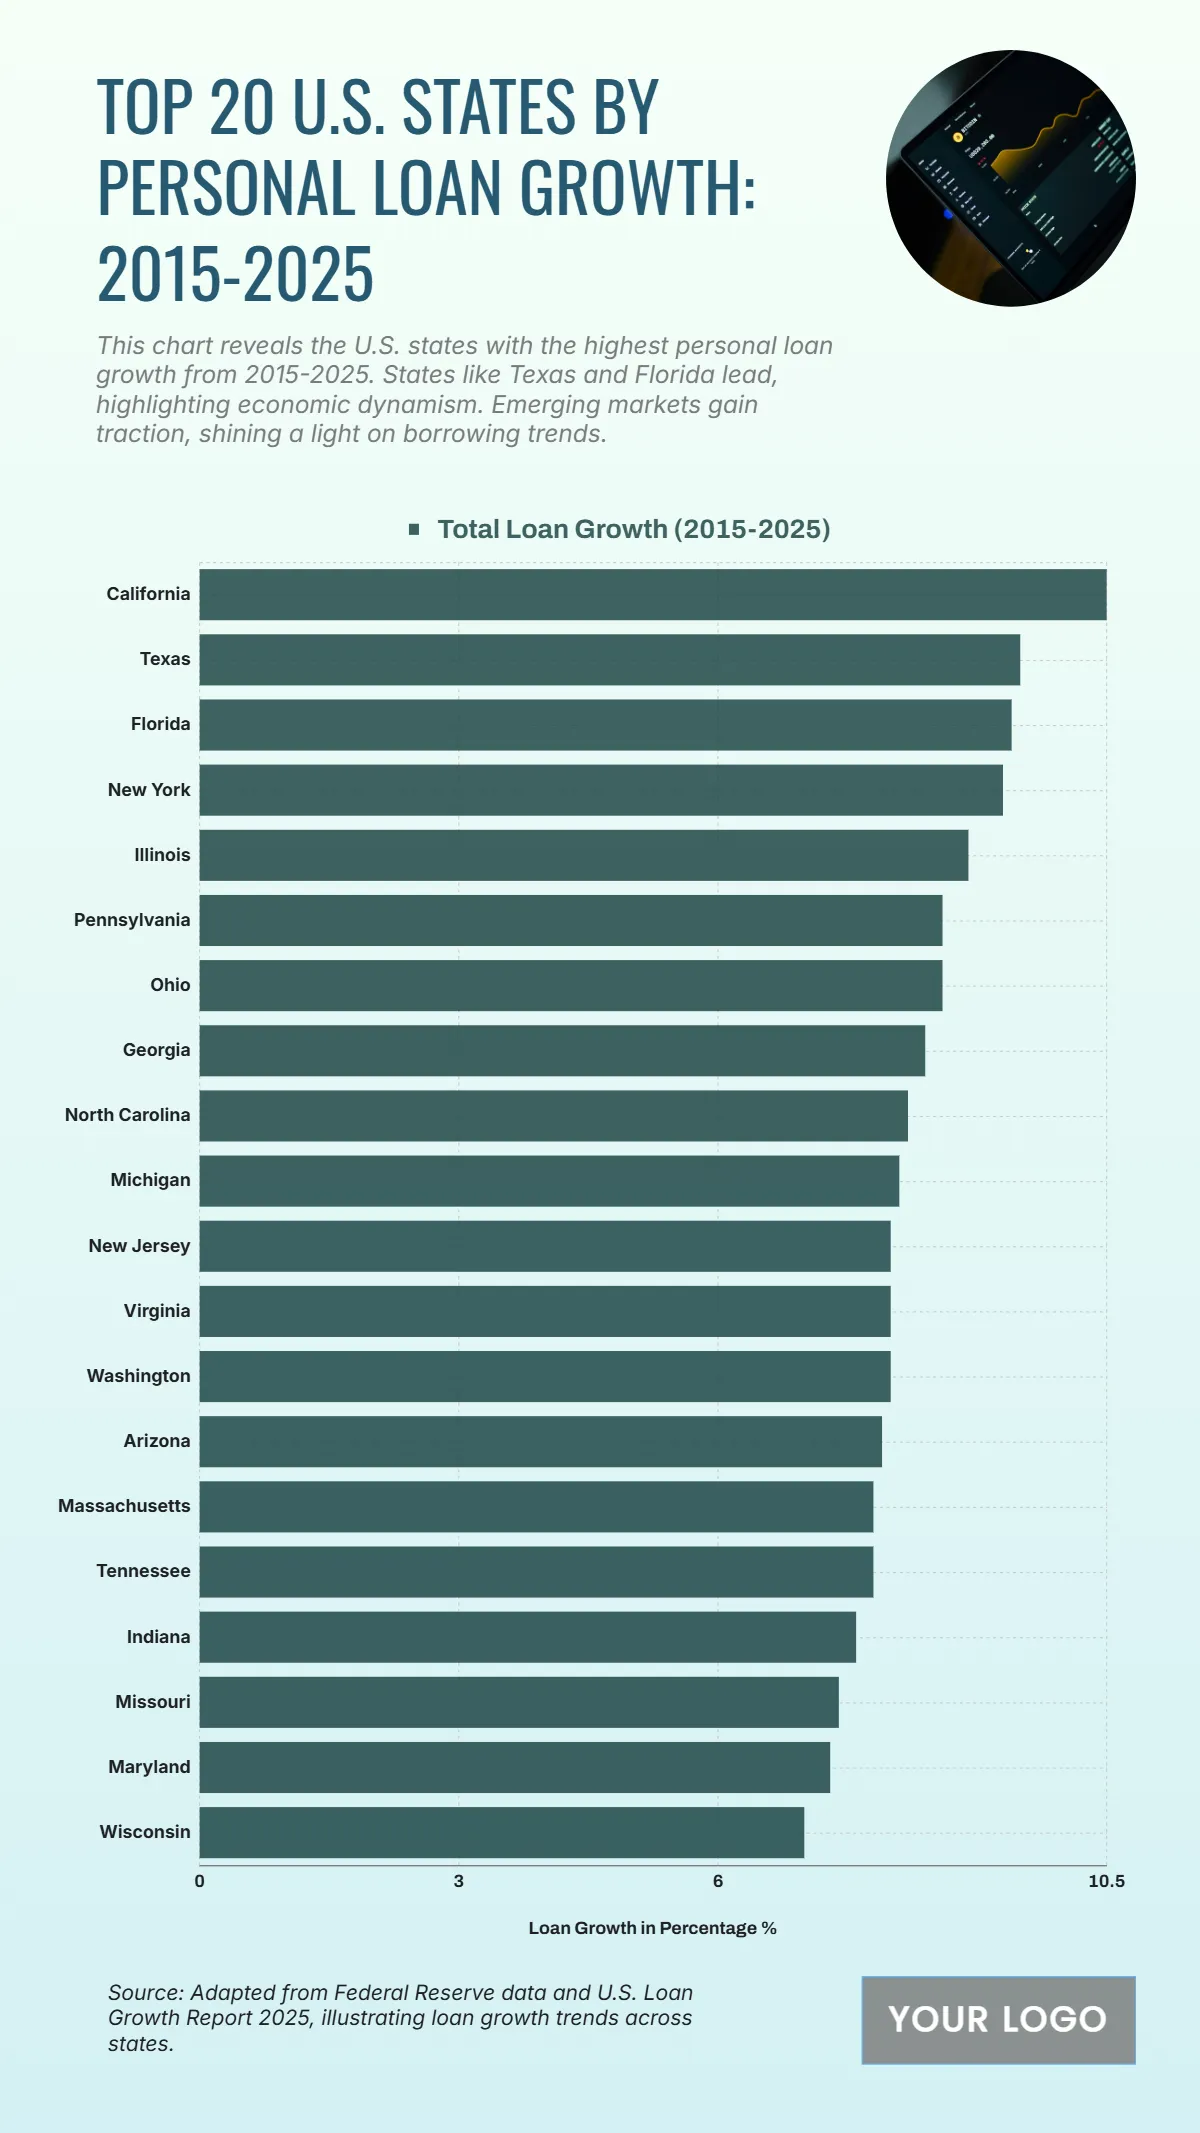
The chart highlights the U.S. states with the highest personal loan growth from 2015 to 2025, showing how borrowing trends have expanded significantly over the past decade. California leads with the highest total loan growth of 10.5%, reflecting strong credit activity and economic expansion. Texas follows at 9.5%, while Florida records 9.4%, and New York stands at 9.3%, indicating concentrated borrowing in economically dynamic states. Illinois posts 8.9%, and both Pennsylvania and Ohio record 8.6%. Georgia shows a growth of 8.4%, with North Carolina at 8.2% and Michigan at 8.1%, rounding out the top ten. Other states such as New Jersey, Virginia, and Washington all register 8.0%, followed by modest but notable growth in Arizona (7.9%), Massachusetts and Tennessee (7.8%), and Wisconsin with the lowest among the top 20 at 7.0%. These figures underscore a nationwide trend of increasing personal loan utilization.
| Labels | Total Loan Growth (2015–2025) |
|---|---|
| California | 10.5 |
| Texas | 9.5 |
| Florida | 9.4 |
| New York | 9.3 |
| Illinois | 8.9 |
| Pennsylvania | 8.6 |
| Ohio | 8.6 |
| Georgia | 8.4 |
| North Carolina | 8.2 |
| Michigan | 8.1 |
| New Jersey | 8.0 |
| Virginia | 8.0 |
| Washington | 8.0 |
| Arizona | 7.9 |
| Massachusetts | 7.8 |
| Tennessee | 7.8 |
| Indiana | 7.6 |
| Missouri | 7.4 |
| Maryland | 7.3 |
| Wisconsin | 7.0 |


