Free U.S. Top 10 States with the Highest R&D Spending (2018-2025) Chart
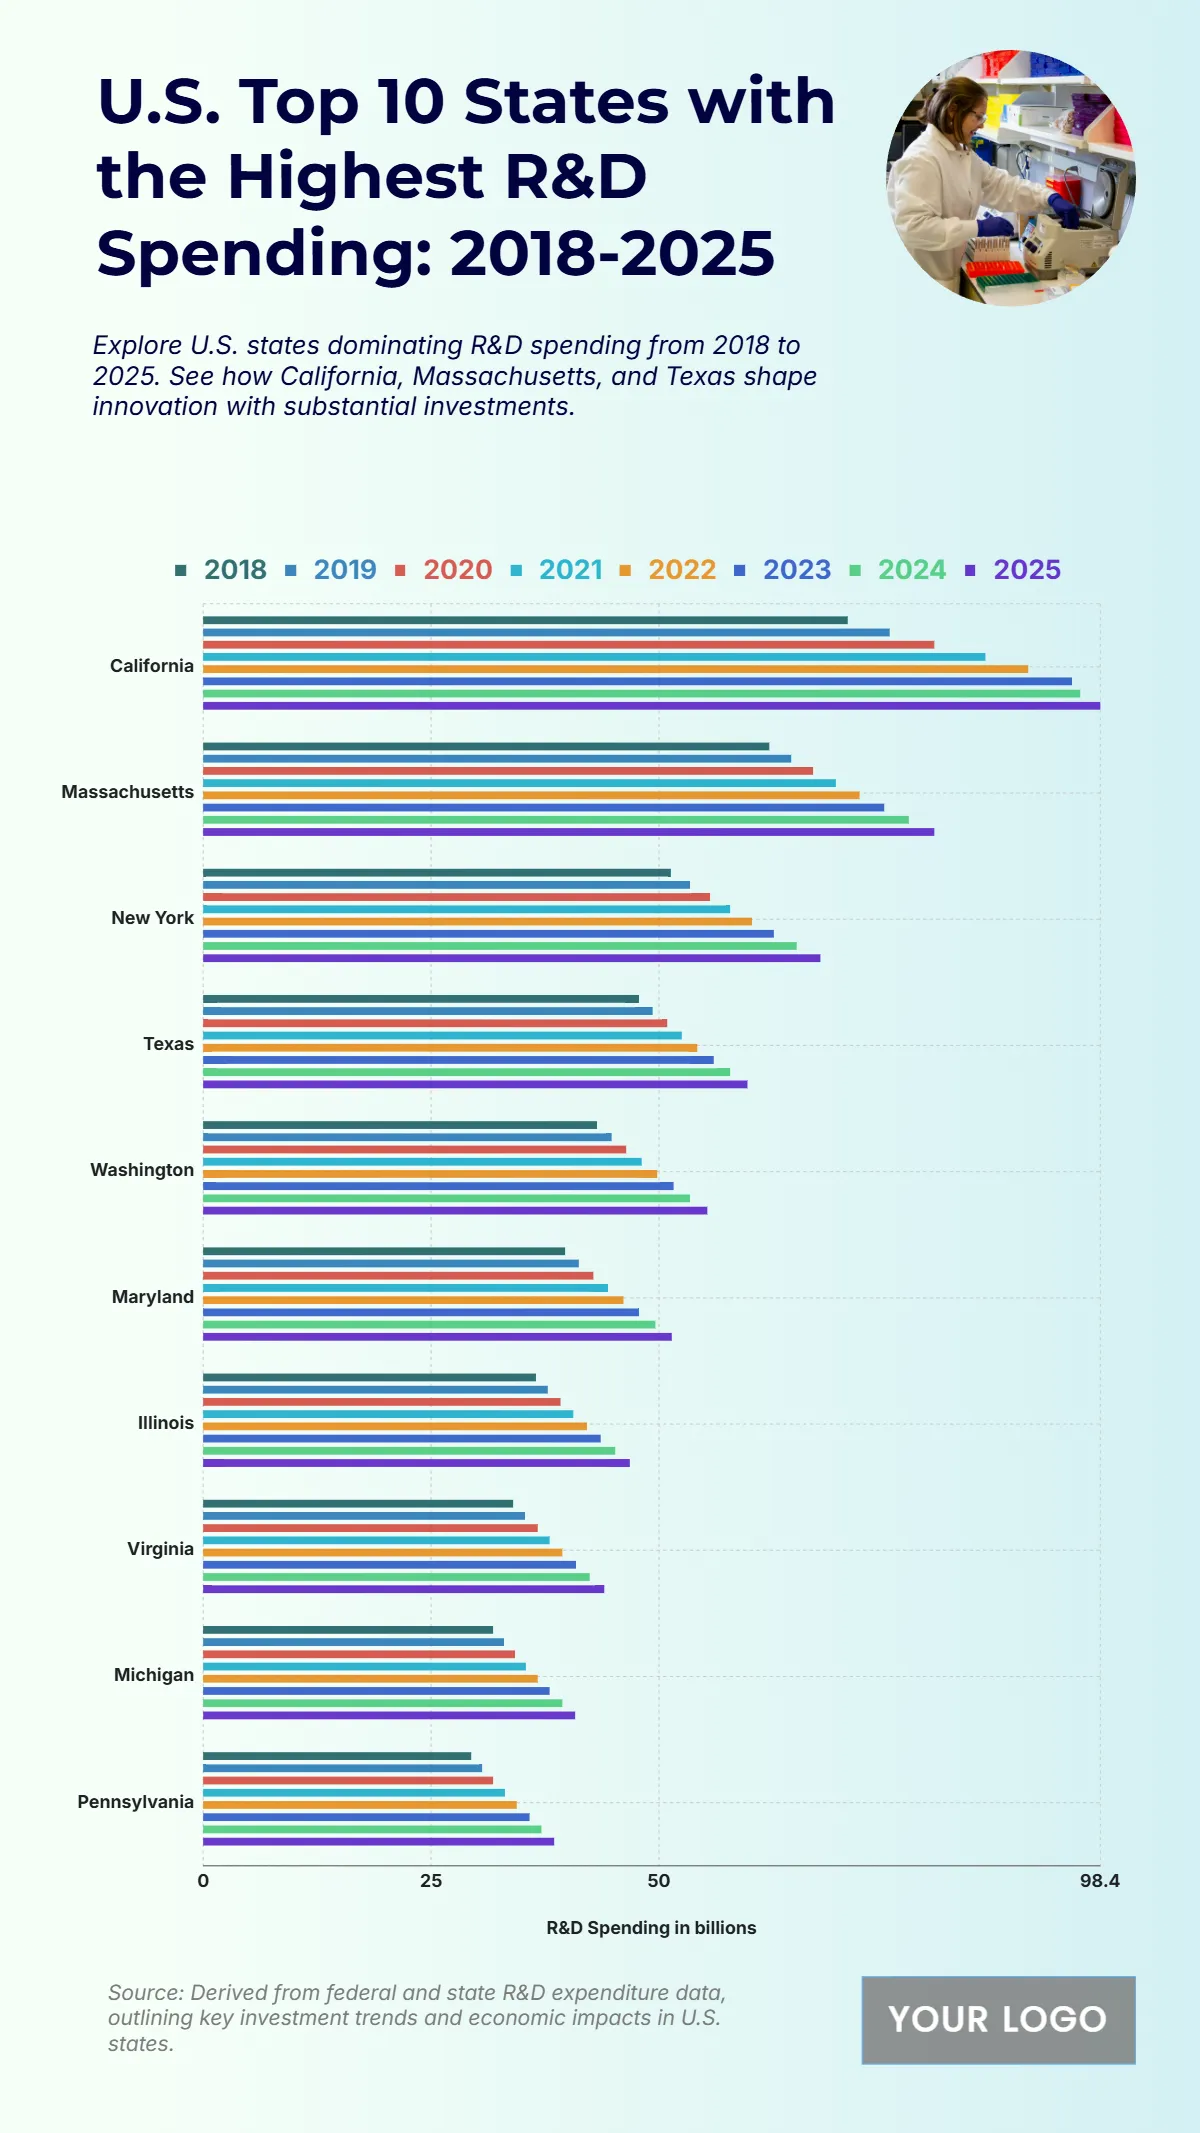
The chart presents the states with the highest R&D spending from 2018 to 2025, highlighting substantial investments in innovation and technology. California leads throughout the period, increasing from $70.7 billion in 2018 to a projected $98.4 billion in 2025, showing consistent growth and leadership in research funding. Massachusetts ranks second, growing from $62.1 billion to $80.2 billion, followed by New York with an increase from $51.3 billion to $67.7 billion. Texas rises from $47.8 billion to $59.7 billion, while Washington grows steadily from $43.2 billion to $55.3 billion. States like Maryland, Illinois, Virginia, Michigan, and Pennsylvania also show steady increases in their R&D investments, contributing to national innovation capacity. This upward trend across states emphasizes expanding commitments to research, technological advancement, and economic competitiveness, with major investment hubs driving most of the growth.
| Labels | 2018 | 2019 | 2020 | 2021 | 2022 | 2023 | 2024 | 2025 |
|---|---|---|---|---|---|---|---|---|
| California | 70.7 | 75.3 | 80.2 | 85.8 | 90.5 | 95.3 | 96.2 | 98.4 |
| Massachusetts | 62.1 | 64.5 | 66.9 | 69.4 | 72.0 | 74.7 | 77.4 | 80.2 |
| New York | 51.3 | 53.4 | 55.6 | 57.8 | 60.2 | 62.6 | 65.1 | 67.7 |
| Texas | 47.8 | 49.3 | 50.9 | 52.5 | 54.2 | 56.0 | 57.8 | 59.7 |
| Washington | 43.2 | 44.8 | 46.4 | 48.1 | 49.8 | 51.6 | 53.4 | 55.3 |
| Maryland | 39.7 | 41.2 | 42.8 | 44.4 | 46.1 | 47.8 | 49.6 | 51.4 |
| Illinois | 36.5 | 37.8 | 39.2 | 40.6 | 42.1 | 43.6 | 45.2 | 46.8 |
| Virginia | 34.0 | 35.3 | 36.7 | 38.0 | 39.4 | 40.9 | 42.4 | 44.0 |
| Michigan | 31.8 | 33.0 | 34.2 | 35.4 | 36.7 | 38.0 | 39.4 | 40.8 |
| Pennsylvania | 29.4 | 30.6 | 31.8 | 33.1 | 34.4 | 35.8 | 37.1 | 38.5 |


