Free U.S. Top 10 States by Total Energy Consumption (2020-2025) Chart
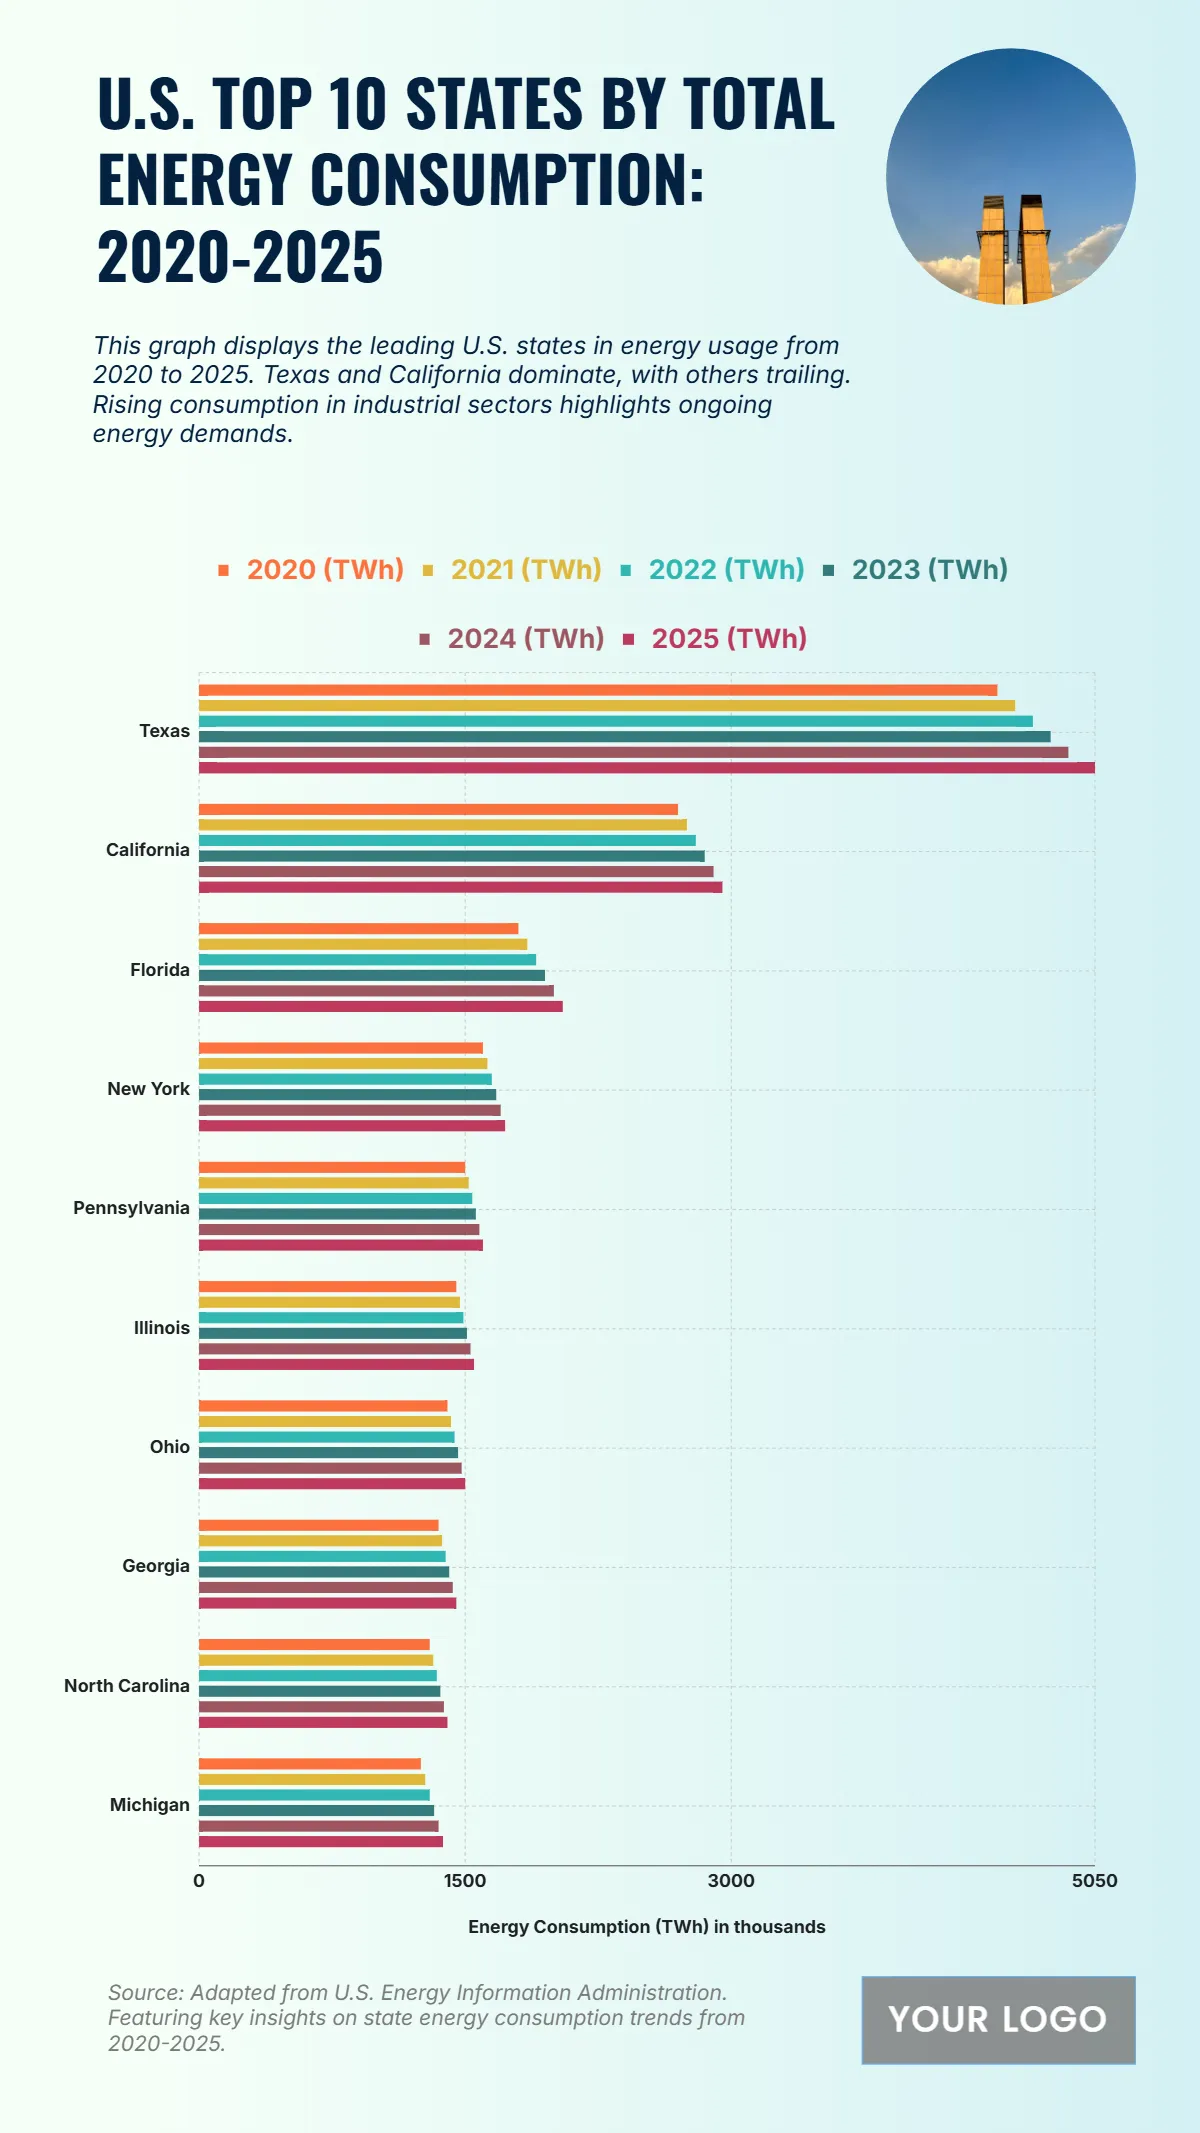
The chart illustrates energy consumption trends across the top states from 2020 to 2025, reflecting steady growth in demand. Texas consistently leads by a wide margin, starting at 4500 TWh in 2020 and reaching a projected 5050 TWh in 2025, driven by its large industrial and residential consumption base. California follows with 2700 TWh in 2020, increasing to 2950 TWh in 2025. Florida shows a gradual climb from 1800 TWh to 2050 TWh, while New York rises from 1600 TWh to 1725 TWh over the same period. Pennsylvania and Illinois show moderate but consistent growth, reaching 1600 TWh and 1550 TWh by 2025 respectively. States like Ohio, Georgia, North Carolina, and Michigan exhibit smaller but steady increments, reflecting stable economic and residential energy use. These trends underline the growing energy needs across key states, highlighting Texas and California as the dominant energy consumers.
| Labels | 2020 (TWh) | 2021 (TWh) | 2022 (TWh) | 2023 (TWh) | 2024 (TWh) | 2025 (TWh) |
|---|---|---|---|---|---|---|
| Texas | 4500 | 4600 | 4700 | 4800 | 4900 | 5050 |
| California | 2700 | 2750 | 2800 | 2850 | 2900 | 2950 |
| Florida | 1800 | 1850 | 1900 | 1950 | 2000 | 2050 |
| New York | 1600 | 1625 | 1650 | 1675 | 1700 | 1725 |
| Pennsylvania | 1500 | 1520 | 1540 | 1560 | 1580 | 1600 |
| Illinois | 1450 | 1470 | 1490 | 1510 | 1530 | 1550 |
| Ohio | 1400 | 1420 | 1440 | 1460 | 1480 | 1500 |
| Georgia | 1350 | 1370 | 1390 | 1410 | 1430 | 1450 |
| North Carolina | 1300 | 1320 | 1340 | 1360 | 1380 | 1400 |
| Michigan | 1250 | 1275 | 1300 | 1325 | 1350 | 1375 |


