Free Top 20 U.S. States by Child Poverty Rate (2018-2025) Chart
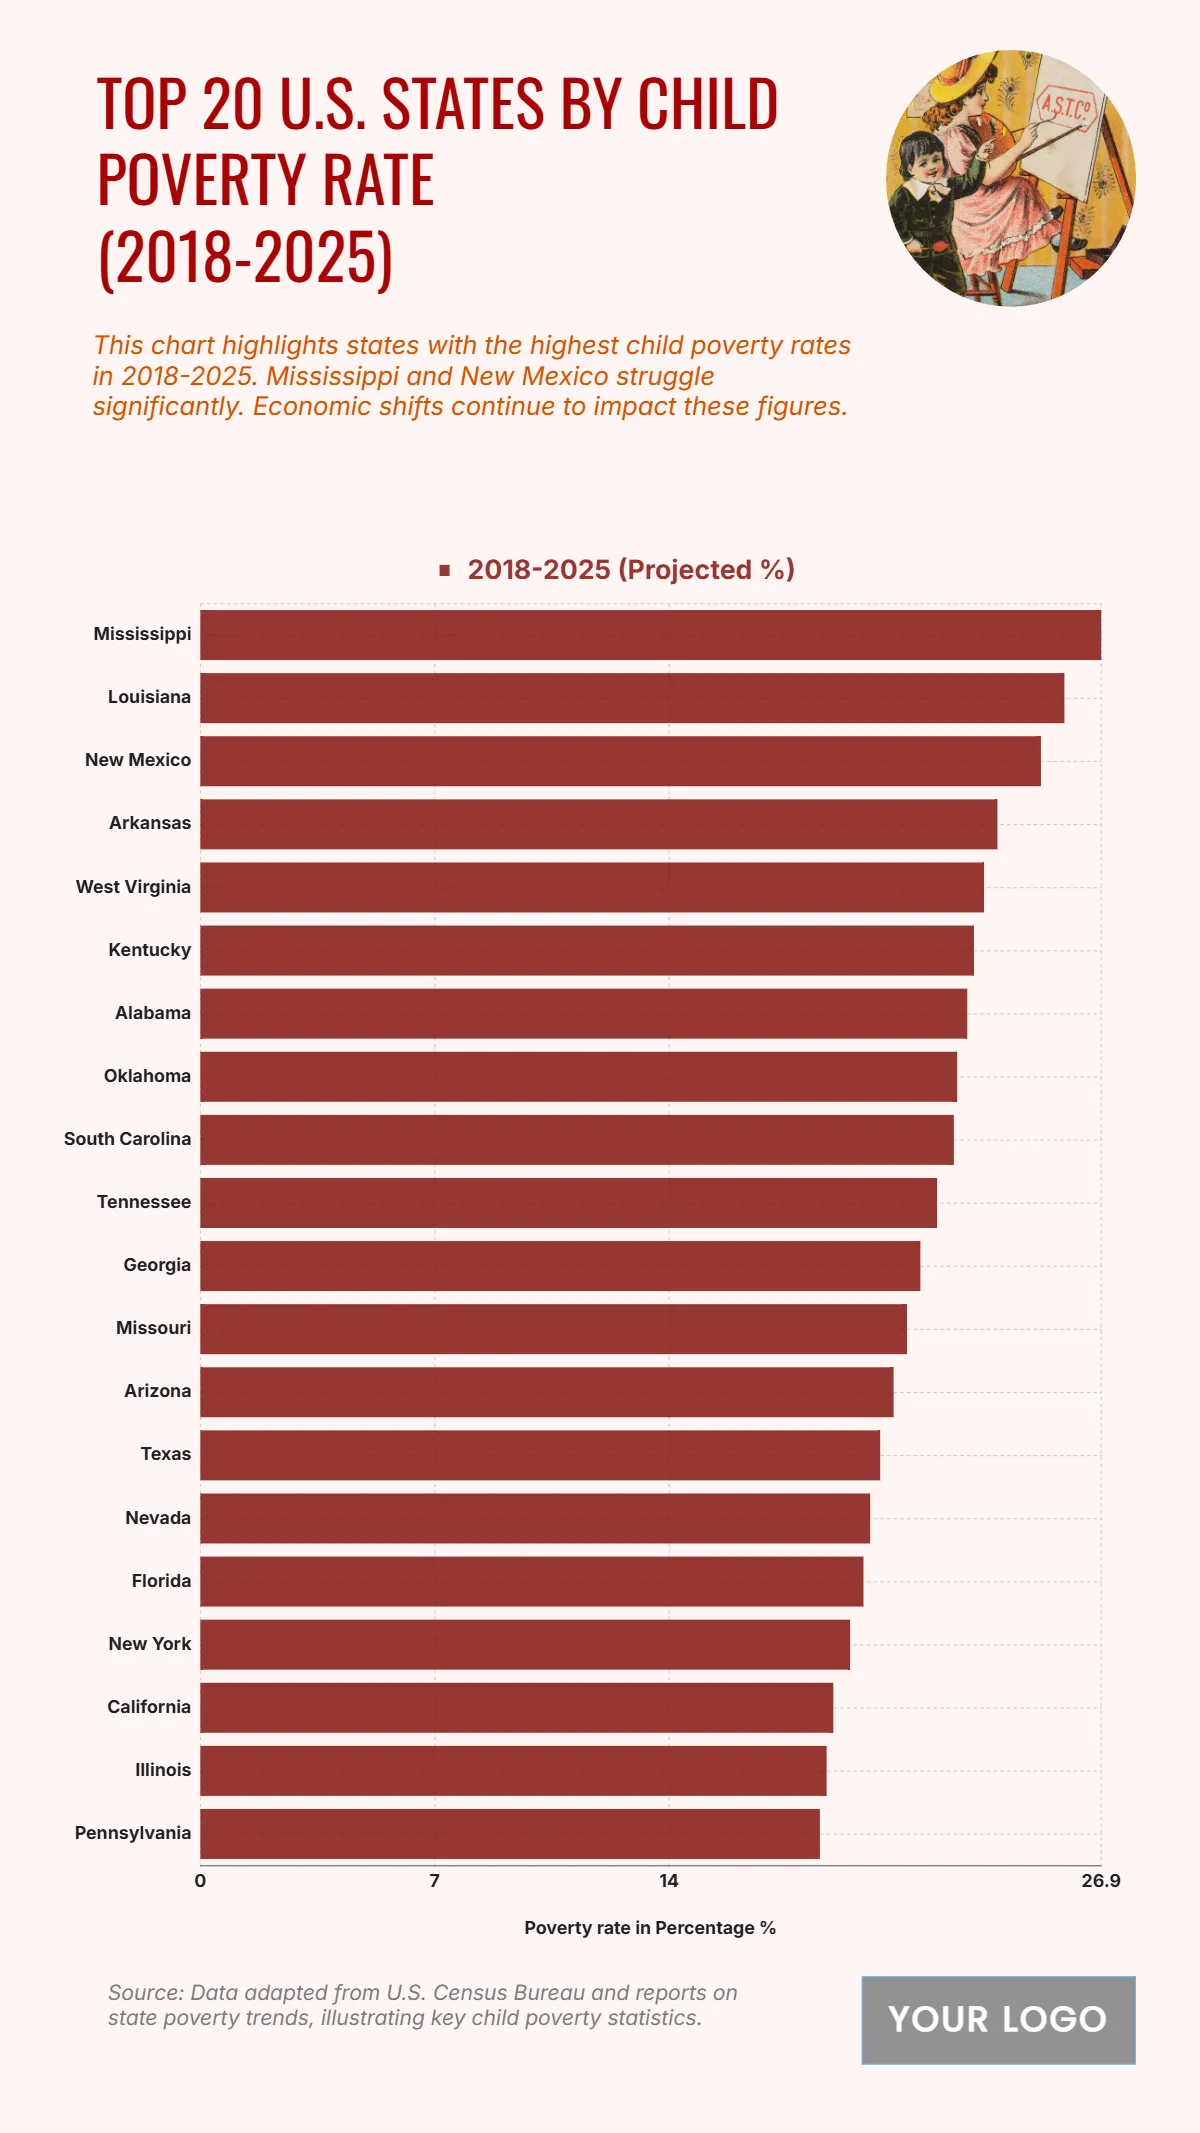
The chart reveals projected child poverty rates across states from 2018 to 2025, showing persistent socioeconomic challenges in certain regions. Mississippi has the highest rate at 26.9%, followed by Louisiana at 25.8% and New Mexico at 25.1%, reflecting deep-rooted economic disparities. Arkansas registers 23.8%, while West Virginia stands at 23.4%, highlighting concentrated poverty in southern and Appalachian areas. Other states with elevated rates include Kentucky (23.1%), Alabama (22.9%), Oklahoma (22.6%), and South Carolina (22.5%). Mid-range rates appear in Tennessee (22%) and Georgia (21.5%), with Missouri at 21.1% and Arizona at 20.7%. States like Texas (20.3%), Nevada (20%), and Florida (19.8%) also show notable poverty levels. Meanwhile, New York (19.4%), California (18.9%), Illinois (18.7%), and Pennsylvania (18.5%) record lower, but still significant, figures. These numbers underscore regional inequalities and the urgency for targeted child welfare programs.
| Labels | 2018–2025 (Projected %) |
|---|---|
| Mississippi | 26.9 |
| Louisiana | 25.8 |
| New Mexico | 25.1 |
| Arkansas | 23.8 |
| West Virginia | 23.4 |
| Kentucky | 23.1 |
| Alabama | 22.9 |
| Oklahoma | 22.6 |
| South Carolina | 22.5 |
| Tennessee | 22.0 |
| Georgia | 21.5 |
| Missouri | 21.1 |
| Arizona | 20.7 |
| Texas | 20.3 |
| Nevada | 20.0 |
| Florida | 19.8 |
| New York | 19.4 |
| California | 18.9 |
| Illinois | 18.7 |
| Pennsylvania | 18.5 |


