Free Top 10 States by Average Hourly Wage (2020–2025)
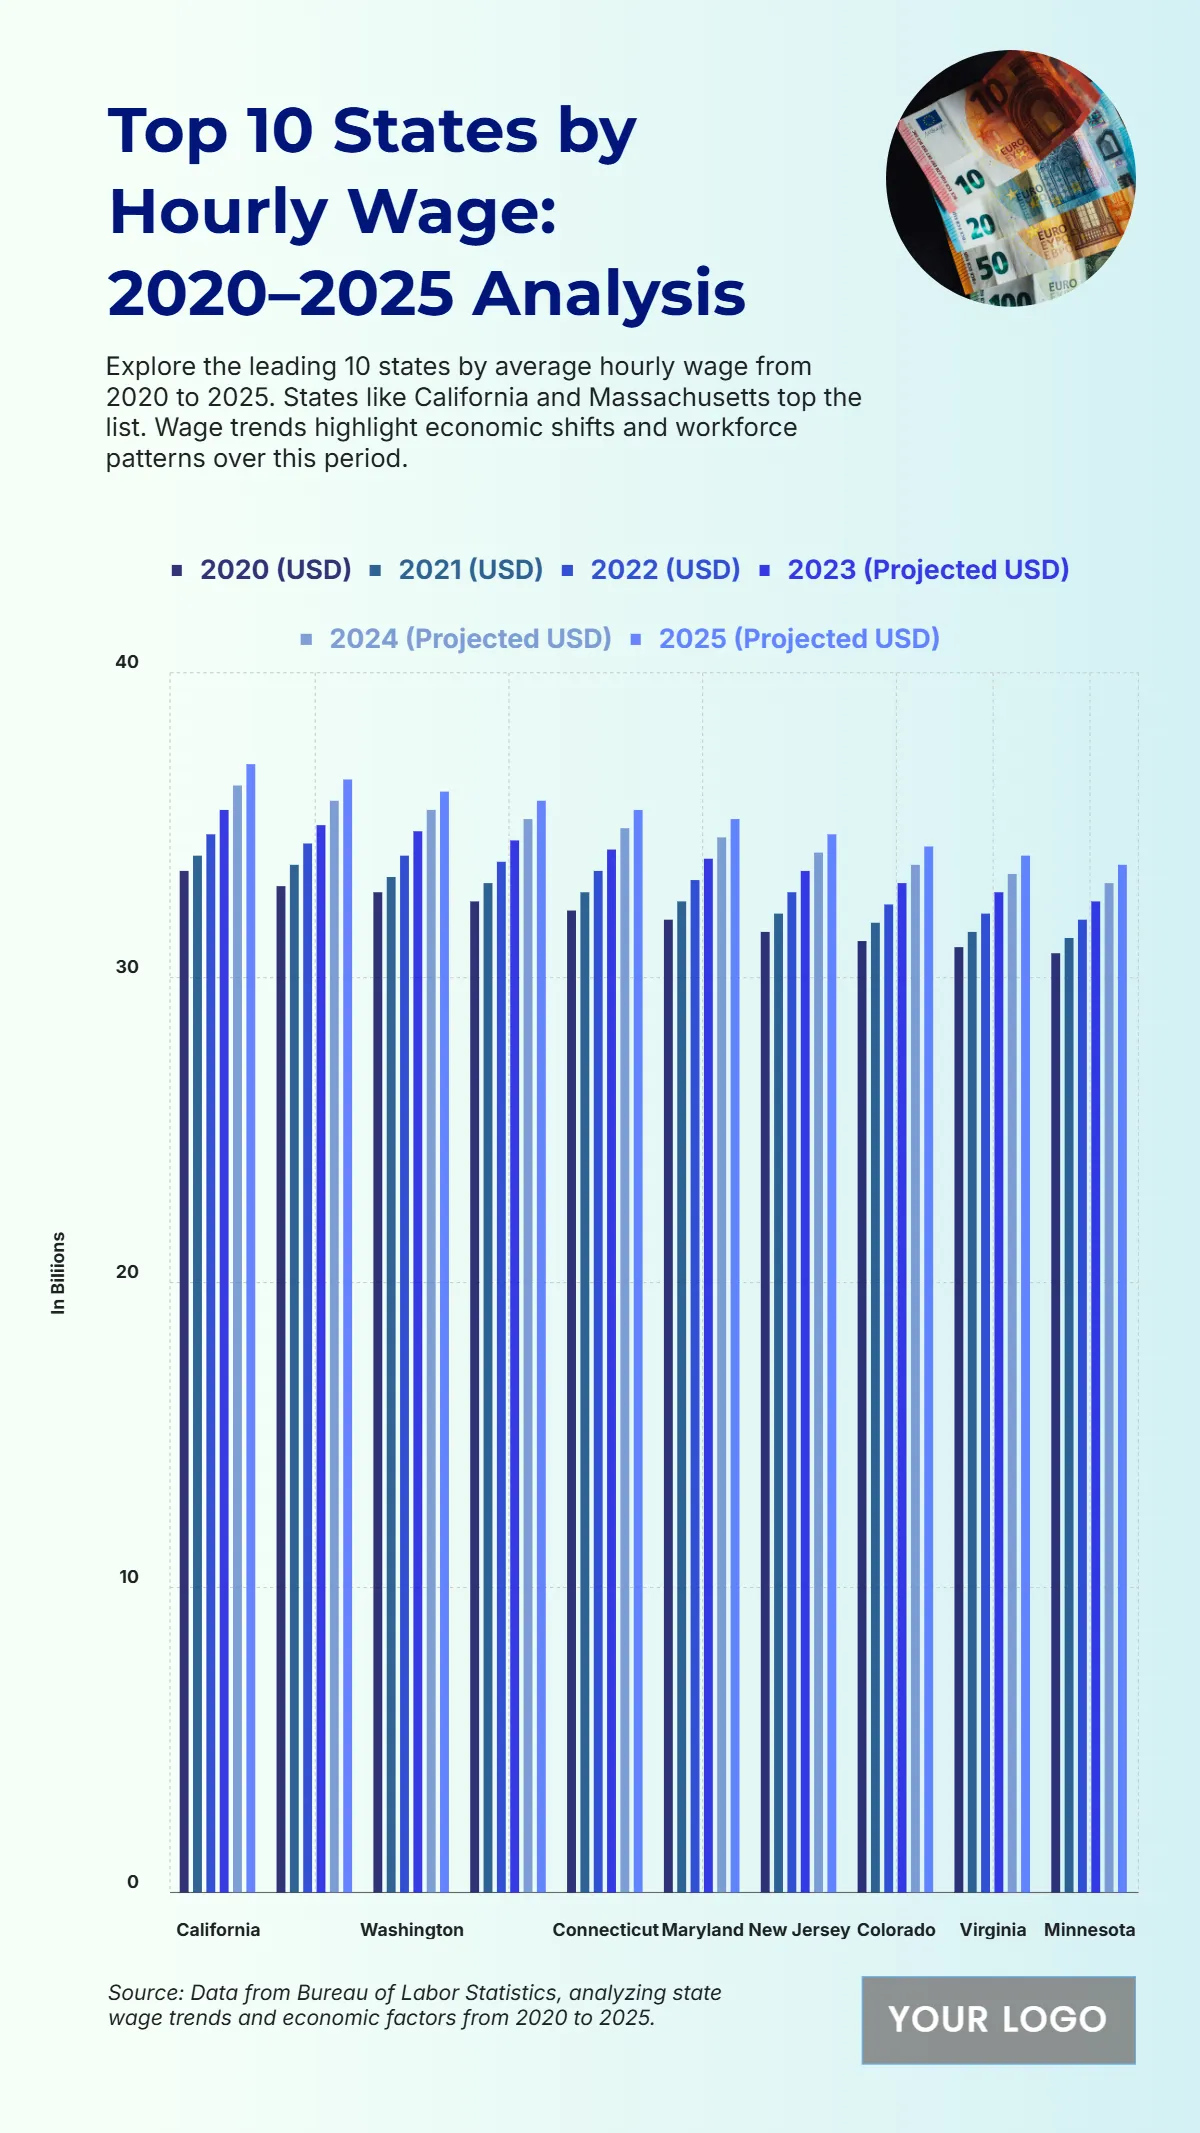
The chart illustrates the rising hourly wage trends from 2020 to 2025 across the top ten U.S. states, reflecting strong wage growth in key economic hubs. California records the highest hourly wage, increasing from $33.5 in 2020 to a projected $37 in 2025, showing steady year-over-year growth. Massachusetts follows closely with wages climbing from $33 to $36.5, while Washington grows from $32.8 to $36.1 in the same period. New York also demonstrates a strong upward trend, moving from $32.5 to $35.8, alongside Connecticut, which rises from $32.2 to $35.5. Mid-tier states like Maryland and New Jersey project hourly wages of $35.2 and $34.7 by 2025, respectively. Colorado, Virginia, and Minnesota show slightly slower but consistent growth, reaching $34.3, $34, and $33.7. Overall, the data highlights wage competitiveness and economic expansion in these states.
| Labels | 2020 (USD) | 2021 (USD) | 2022 (USD) | 2023 (Projected USD) | 2024 (Projected USD) | 2025 (Projected USD) |
|---|---|---|---|---|---|---|
| California | 33.5 | 34 | 34.7 | 35.5 | 36.3 | 37 |
| Massachusetts | 33 | 33.7 | 34.4 | 35 | 35.8 | 36.5 |
| Washington | 32.8 | 33.3 | 34 | 34.8 | 35.5 | 36.1 |
| New York | 32.5 | 33.1 | 33.8 | 34.5 | 35.2 | 35.8 |
| Connecticut | 32.2 | 32.8 | 33.5 | 34.2 | 34.9 | 35.5 |
| Maryland | 31.9 | 32.5 | 33.2 | 33.9 | 34.6 | 35.2 |
| New Jersey | 31.5 | 32.1 | 32.8 | 33.5 | 34.1 | 34.7 |
| Colorado | 31.2 | 31.8 | 32.4 | 33.1 | 33.7 | 34.3 |
| Virginia | 31 | 31.5 | 32.1 | 32.8 | 33.4 | 34 |
| Minnesota | 30.8 | 31.3 | 31.9 | 32.5 | 33.1 | 33.7 |


