Free Top 20 U.S. States by Total Foreign Trade Volume (2018–2025)
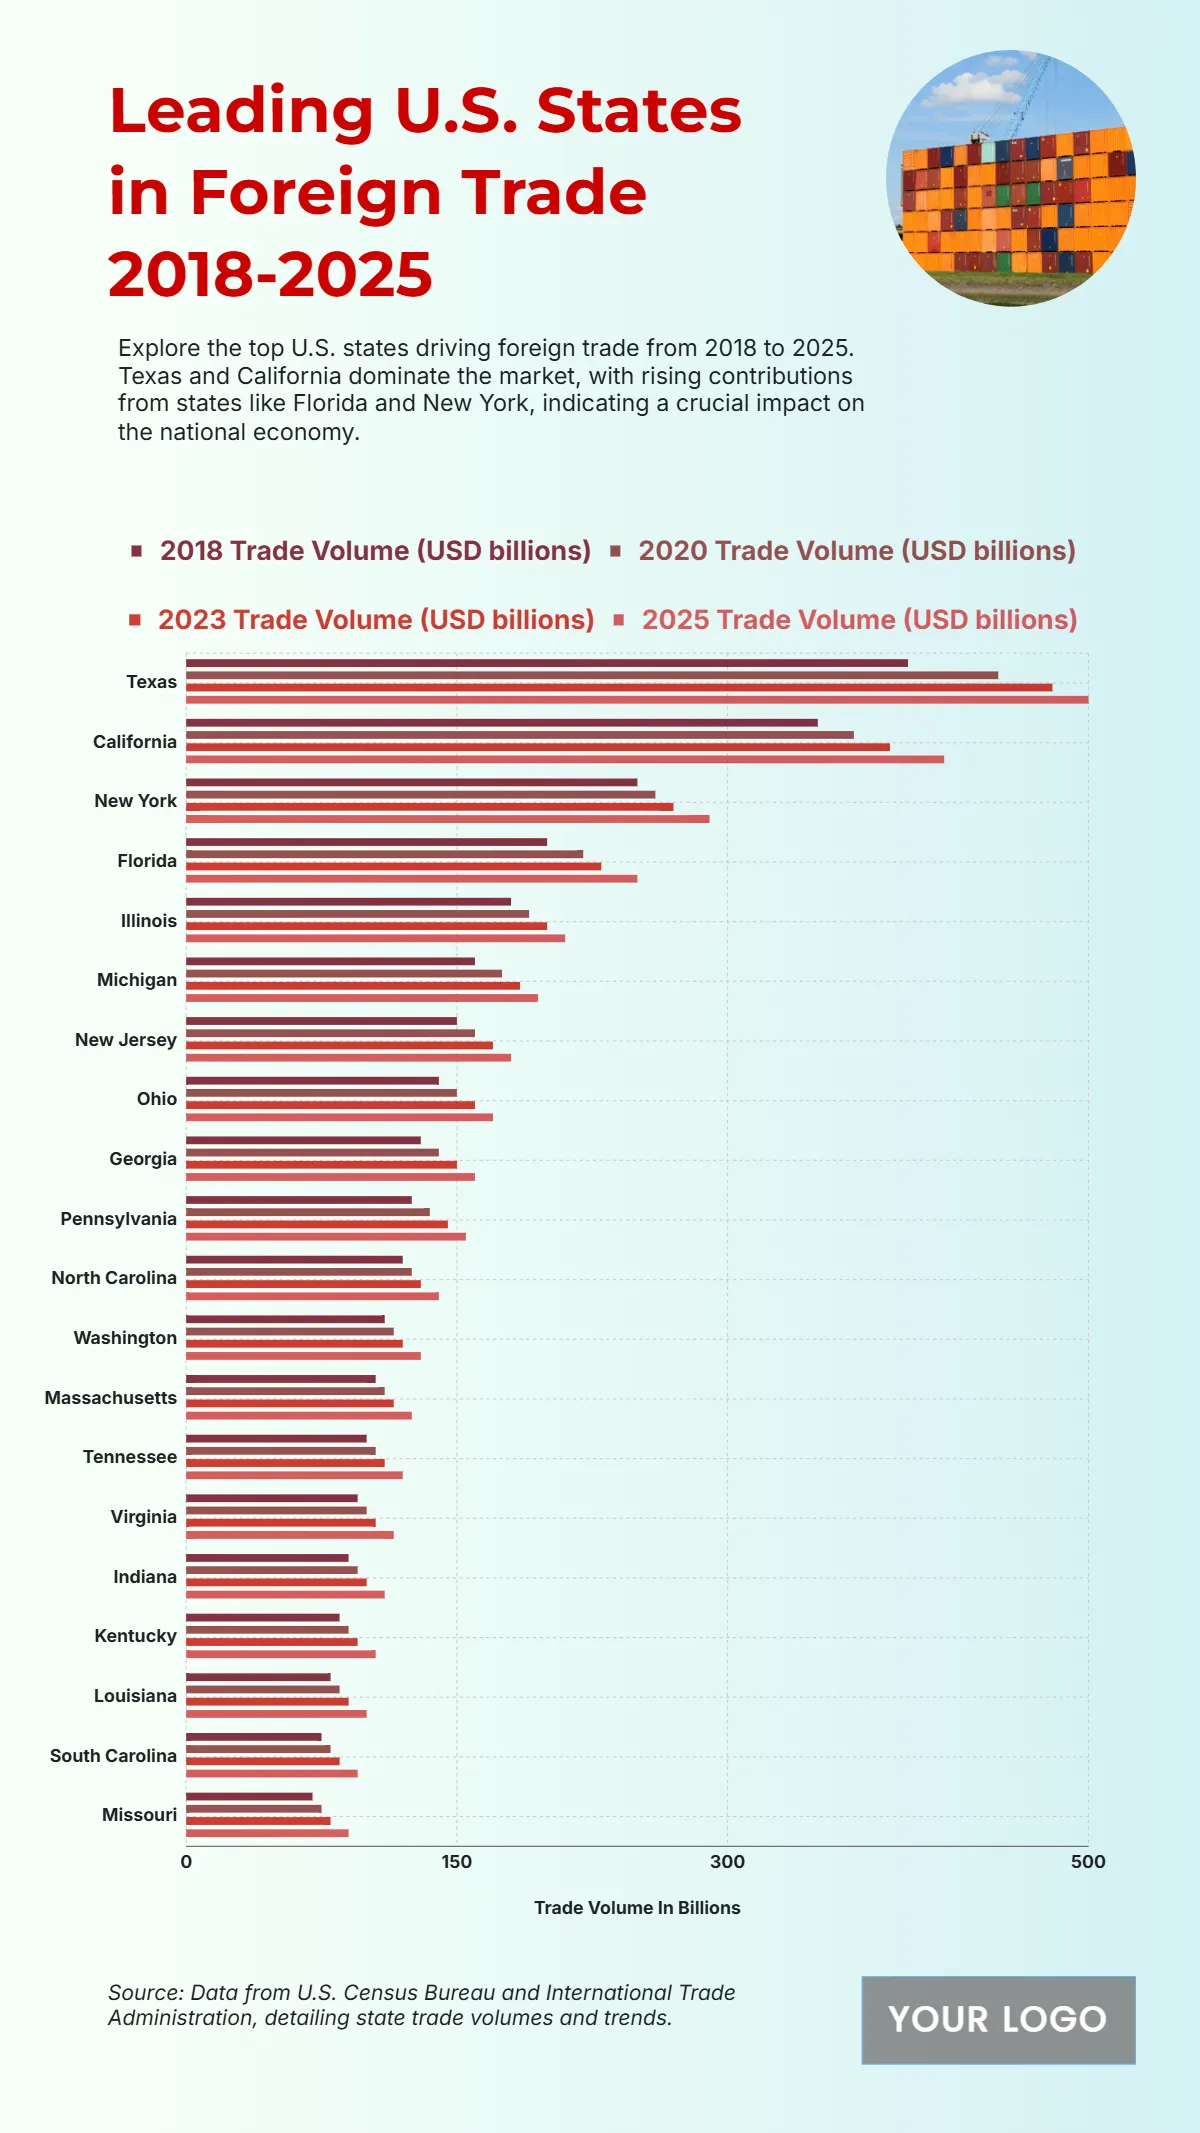
The chart highlights the consistent rise in foreign trade volumes across key U.S. states from 2018 to 2025, showcasing their strong role in global commerce. Texas dominates the rankings, increasing from USD 400 billion in 2018 to USD 480 billion in 2023, reflecting its strong export and import network. California follows with USD 350 billion in 2018, rising to USD 390 billion in 2023, underscoring its central role in international trade. New York records steady growth from USD 250 billion to USD 270 billion, while Florida climbs from USD 200 billion to USD 230 billion. Mid-tier states such as Illinois and Michigan show growth to USD 200 billion and USD 185 billion, respectively. Other states like New Jersey, Ohio, and Georgia also display upward trends, reflecting broad-based economic expansion and trade integration nationwide.
| Labels | 2018 Trade Volume (USD billions) | 2020 Trade Volume (USD billions) | 2023 Trade Volume (USD billions) |
|---|---|---|---|
| Texas | 400 | 450 | 480 |
| California | 350 | 370 | 390 |
| New York | 250 | 260 | 270 |
| Florida | 200 | 220 | 230 |
| Illinois | 180 | 190 | 200 |
| Michigan | 160 | 175 | 185 |
| New Jersey | 150 | 160 | 170 |
| Ohio | 140 | 150 | 160 |
| Georgia | 130 | 140 | 150 |
| Pennsylvania | 125 | 135 | 145 |
| North Carolina | 120 | 125 | 130 |
| Washington | 110 | 115 | 120 |
| Massachusetts | 105 | 110 | 115 |
| Tennessee | 100 | 105 | 110 |
| Virginia | 95 | 100 | 105 |
| Indiana | 90 | 95 | 100 |
| Kentucky | 85 | 90 | 95 |
| Louisiana | 80 | 85 | 90 |
| South Carolina | 75 | 80 | 85 |
| Missouri | 70 | 75 | 80 |


