Free U.S. Top 10 States by Technology Sector Exports (2020–2025)
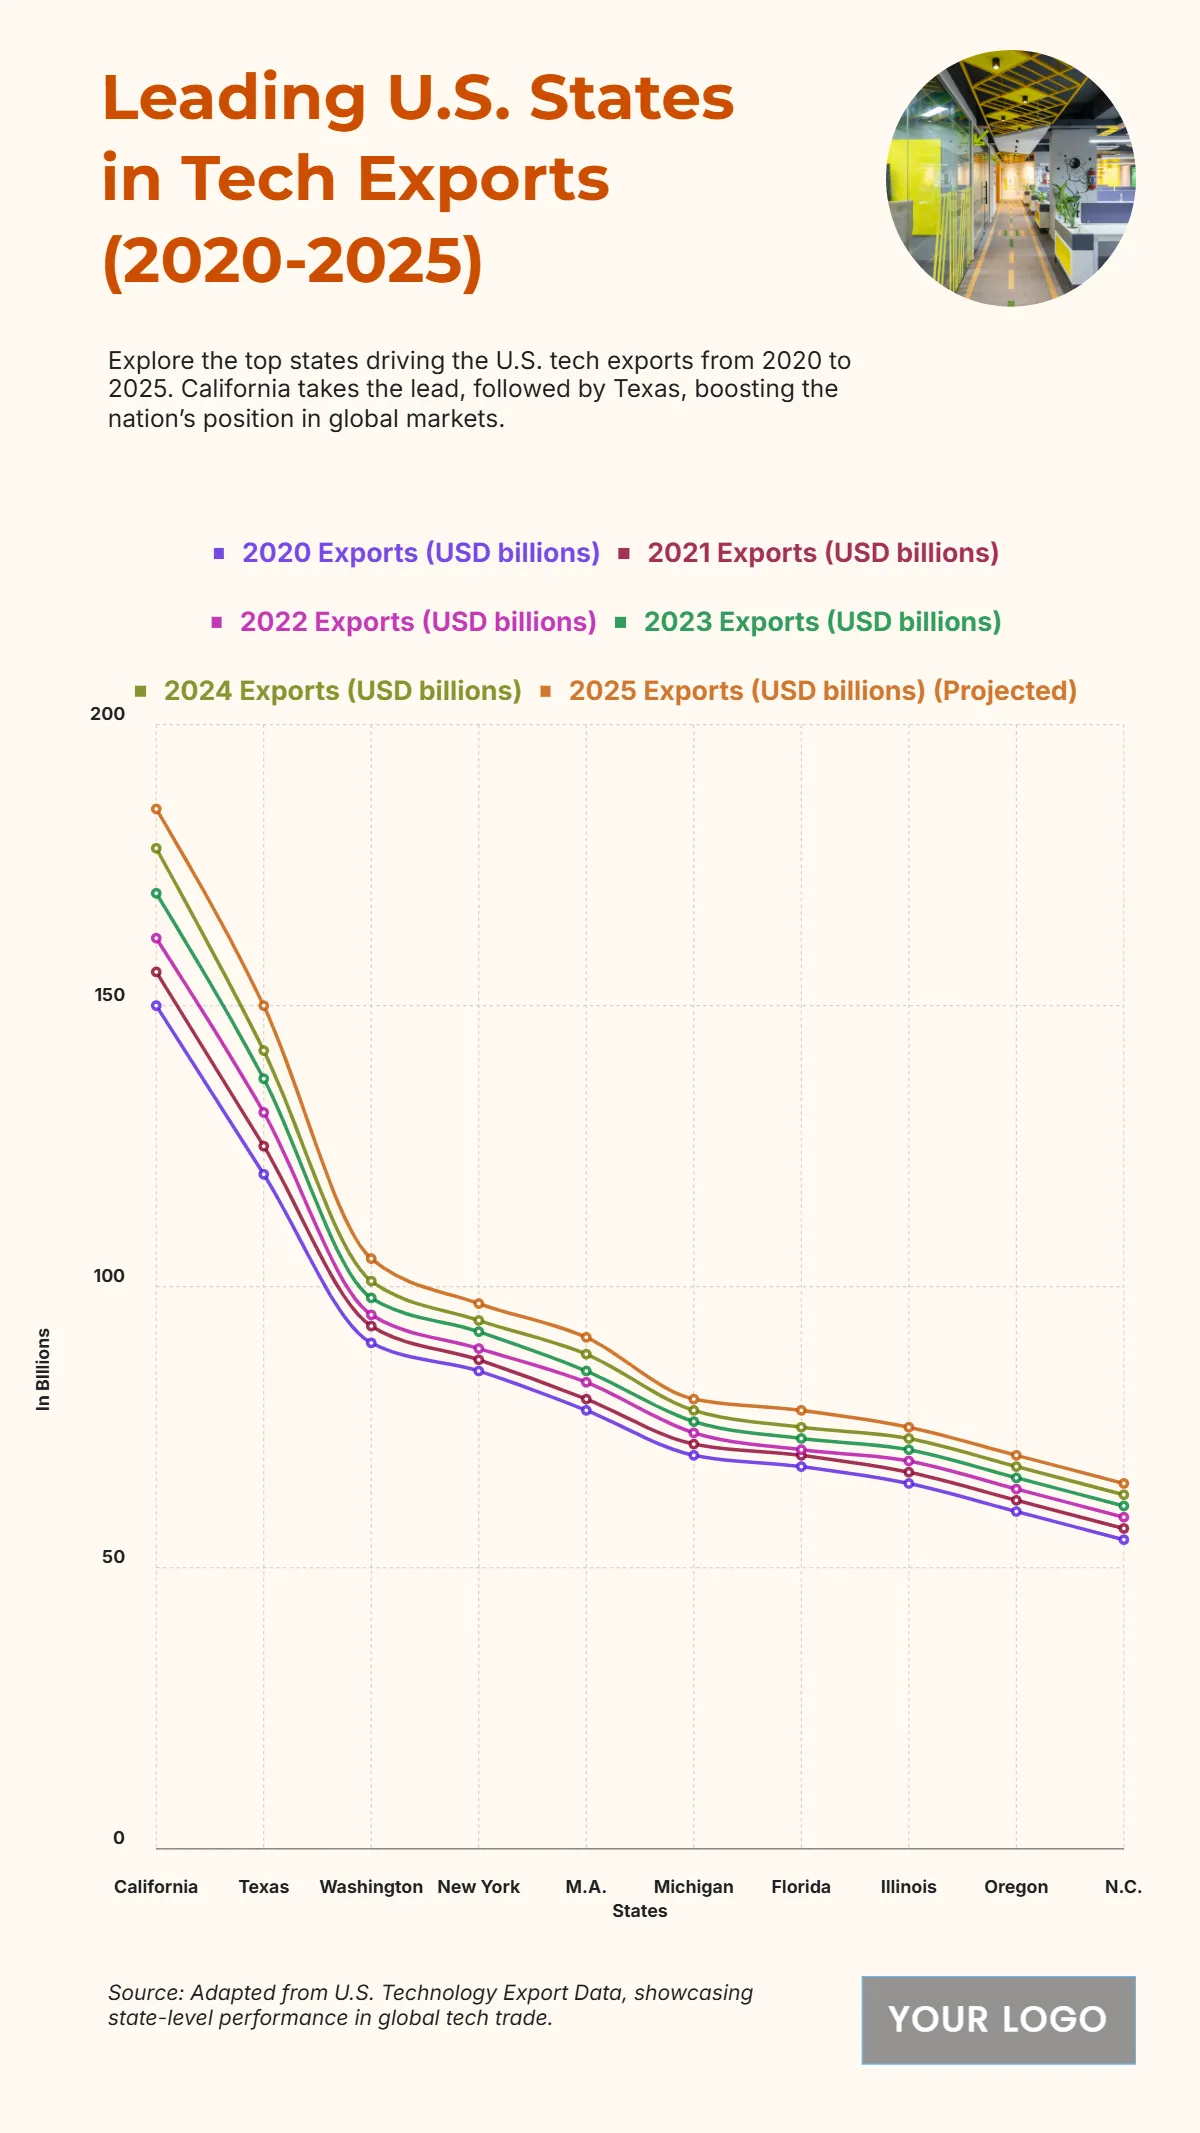
The chart illustrates the steady growth of technology exports in key U.S. states from 2020 to 2025, emphasizing their role in driving global market competitiveness. California dominates with exports climbing from USD 150 billion in 2020 to USD 170 billion in 2023, showcasing its strong tech industry leadership. Texas follows, increasing from USD 120 billion to USD 137 billion, reflecting significant expansion in its innovation sectors. Washington also demonstrates growth, rising from USD 90 billion to USD 98 billion, while New York moves from USD 85 billion to USD 92 billion, and Massachusetts from USD 78 billion to USD 85 billion. Other states such as Michigan, Florida, Illinois, Oregon, and North Carolina show consistent upward trends, with exports increasing between USD 55 billion and USD 73 billion by 2023. This steady rise highlights a robust national tech export landscape.
| Labels | 2020 Exports (USD billions) | 2021 Exports (USD billions) | 2022 Exports (USD billions) | 2023 Exports (USD billions) |
|---|---|---|---|---|
| California | 150 | 156 | 162 | 170 |
| Texas | 120 | 125 | 131 | 137 |
| Washington | 90 | 93 | 95 | 98 |
| New York | 85 | 87 | 89 | 92 |
| M.A. | 78 | 80 | 83 | 85 |
| Michigan | 70 | 72 | 74 | 76 |
| Florida | 68 | 70 | 71 | 73 |
| Illinois | 65 | 67 | 69 | 71 |
| Oregon | 60 | 62 | 64 | 66 |
| N.C. | 55 | 57 | 59 | 61 |


