Free Top 20 U.S. States by Household Debt Growth (2020–2025) Charts
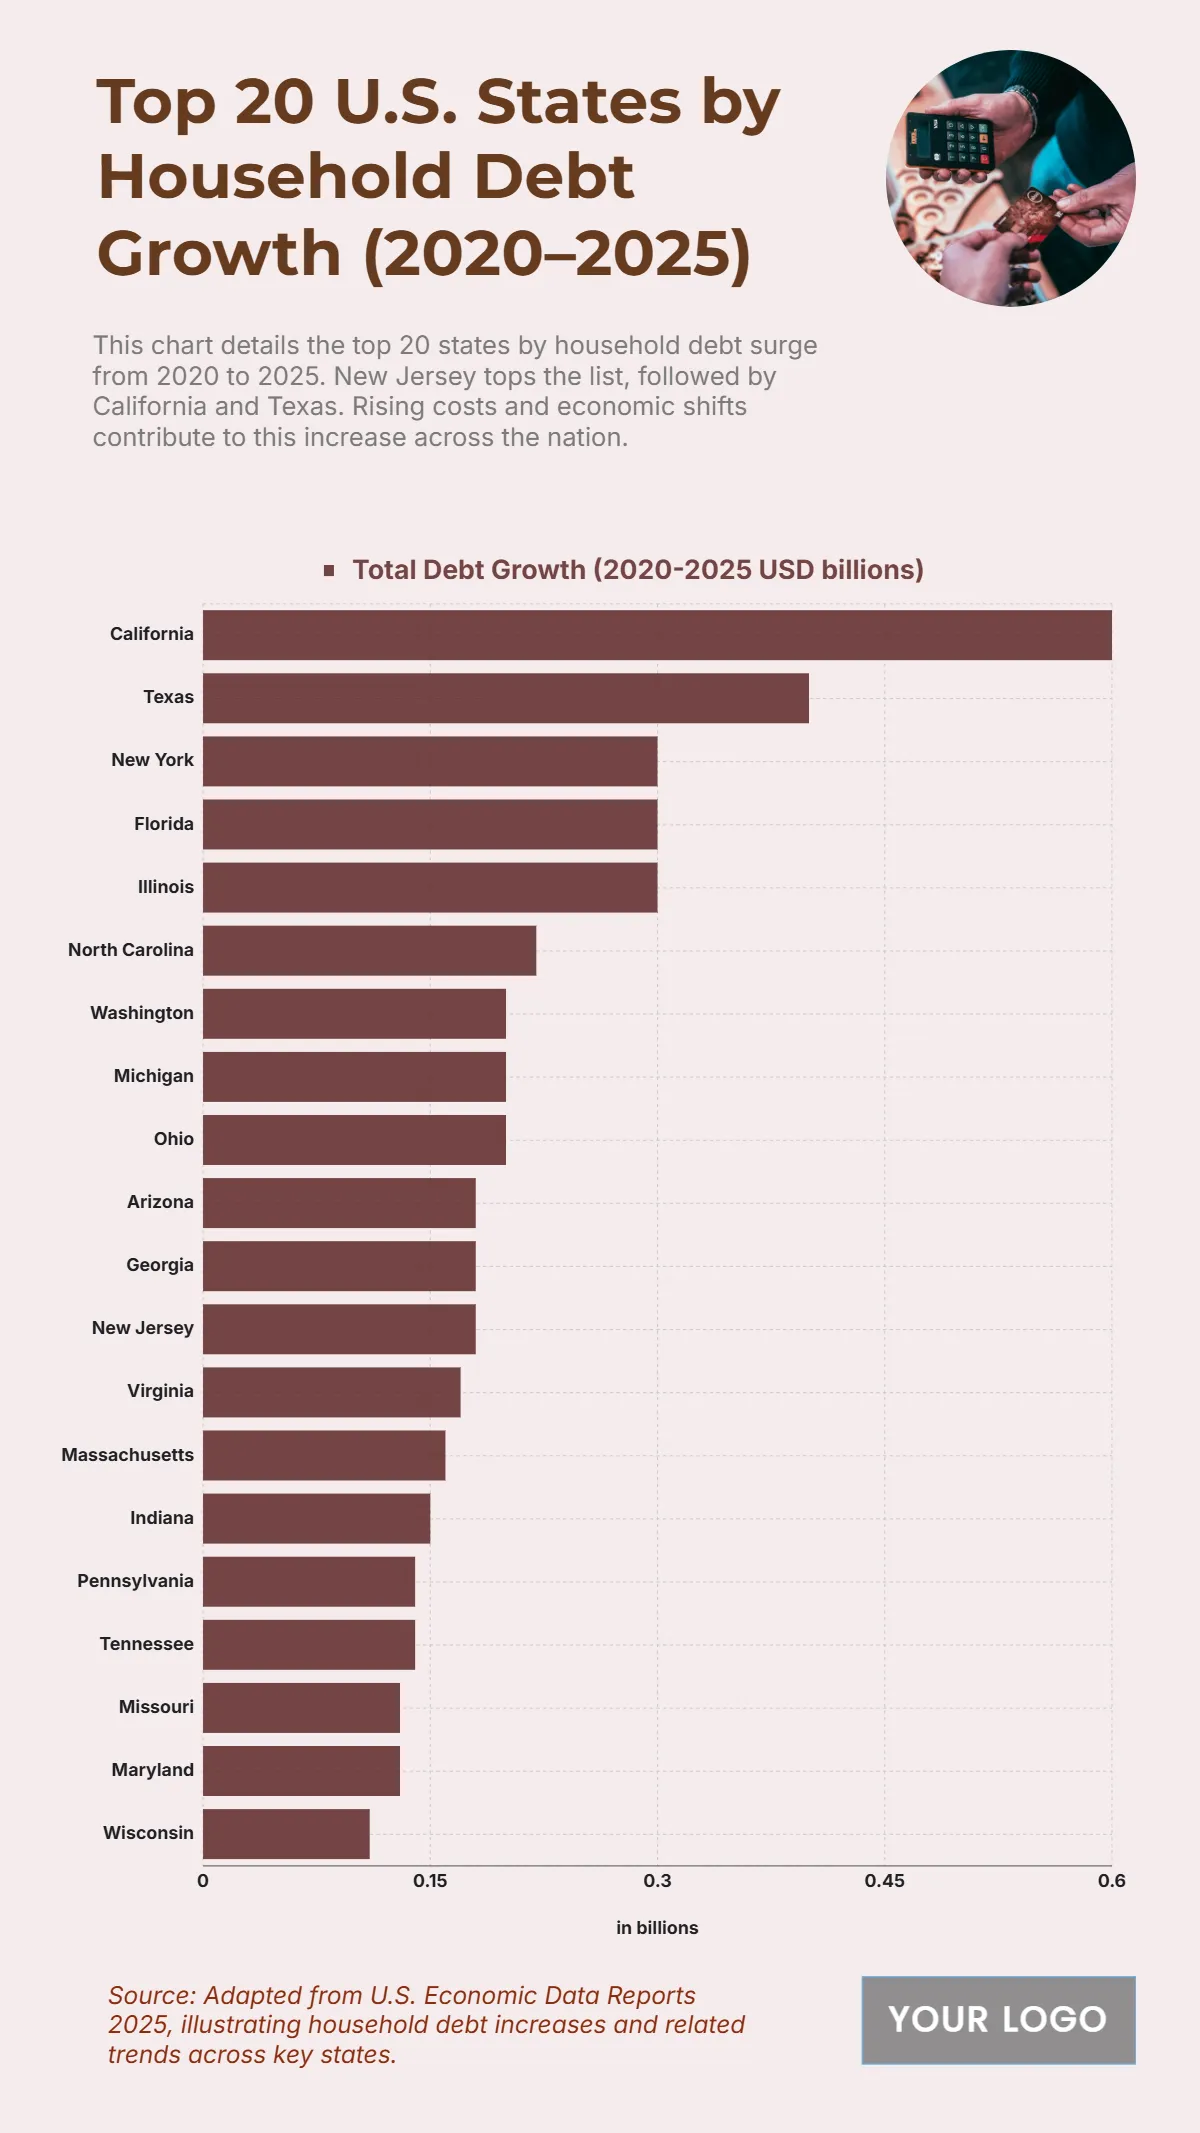
The chart highlights the surge in household debt growth from 2020 to 2025, revealing the states with the highest financial burdens. California records the largest increase at $0.6 trillion, reflecting its high cost of living and significant borrowing trends. Texas follows with $0.4 trillion, emphasizing rapid population and housing growth. New York, Florida, and Illinois each register $0.3 trillion, showing notable debt accumulation across major urban centers. North Carolina reaches $0.22 trillion, while Washington, Michigan, and Ohio are tied at $0.2 trillion, representing steady but moderate increases. Arizona, Georgia, and New Jersey each report $0.18 trillion, followed by Virginia at $0.17 trillion and Massachusetts at $0.16 trillion. Smaller but still impactful growth is seen in Indiana at $0.15 trillion, Pennsylvania and Tennessee at $0.14 trillion, and Missouri at $0.13 trillion, underscoring widespread upward debt trends across the country.
| Labels | Total Debt Growth (2020–2025 USD billions) |
|---|---|
| California | 0.6 |
| Texas | 0.4 |
| New York | 0.3 |
| Florida | 0.3 |
| Illinois | 0.3 |
| North Carolina | 0.22 |
| Washington | 0.2 |
| Michigan | 0.2 |
| Ohio | 0.2 |
| Arizona | 0.18 |
| Georgia | 0.18 |
| New Jersey | 0.18 |
| Virginia | 0.17 |
| Massachusetts | 0.16 |
| Indiana | 0.15 |
| Pennsylvania | 0.14 |
| Tennessee | 0.14 |
| Missouri | 0.13 |


