Free U.S. Top 10 States by Healthcare Expenditures (2018–2025) Charts
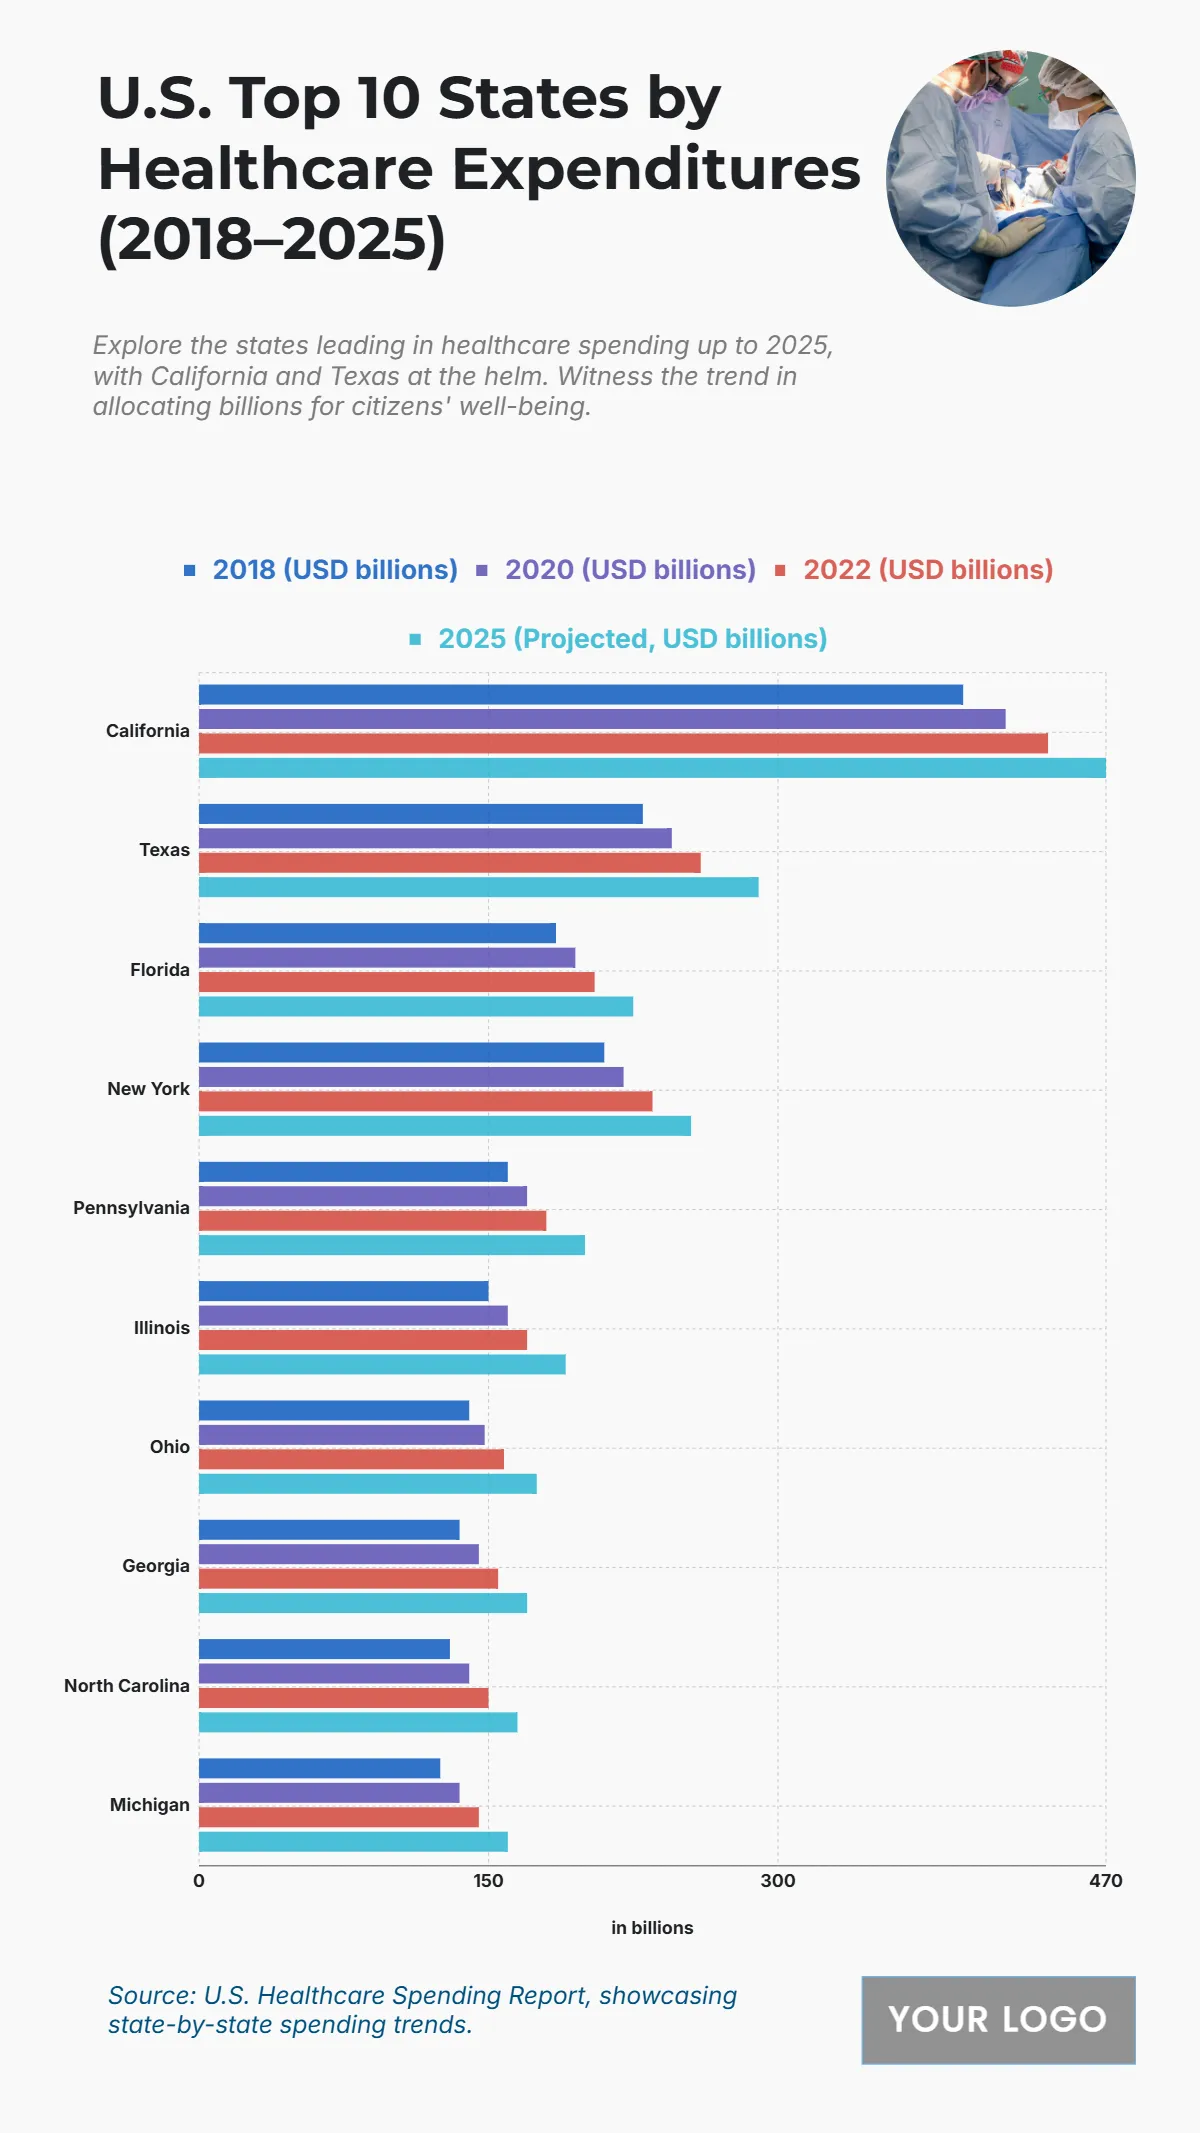
The chart illustrates the growth in healthcare expenditures across the top U.S. states from 2018 to 2025, emphasizing rising costs over time. California records the highest healthcare spending, climbing from $396 billion in 2018 to a projected $470 billion in 2025, highlighting its large population and extensive healthcare infrastructure. Texas follows with an increase from $230 billion to $290 billion, indicating steady growth. Florida grows from $185 billion to $225 billion, while New York rises from $210 billion to $255 billion. Pennsylvania increases from $160 billion to $200 billion, and Illinois from $150 billion to $190 billion. Ohio advances from $140 billion to $175 billion, with Georgia climbing from $135 billion to $170 billion. North Carolina shows an increase from $130 billion to $165 billion, while Michigan grows from $125 billion to $160 billion. This trend reflects the escalating cost of healthcare nationwide.
| Labels | 2018 (USD billions) | 2020 (USD billions) | 2022 (USD billions) | 2025 (Projected, USD billions) |
|---|---|---|---|---|
| California | 396 | 418 | 440 | 470 |
| Texas | 230 | 245 | 260 | 290 |
| Florida | 185 | 195 | 205 | 225 |
| New York | 210 | 220 | 235 | 255 |
| Pennsylvania | 160 | 170 | 180 | 200 |
| Illinois | 150 | 160 | 170 | 190 |
| Ohio | 140 | 148 | 158 | 175 |
| Georgia | 135 | 145 | 155 | 170 |
| North Carolina | 130 | 140 | 150 | 165 |
| Michigan | 125 | 135 | 145 | 160 |


