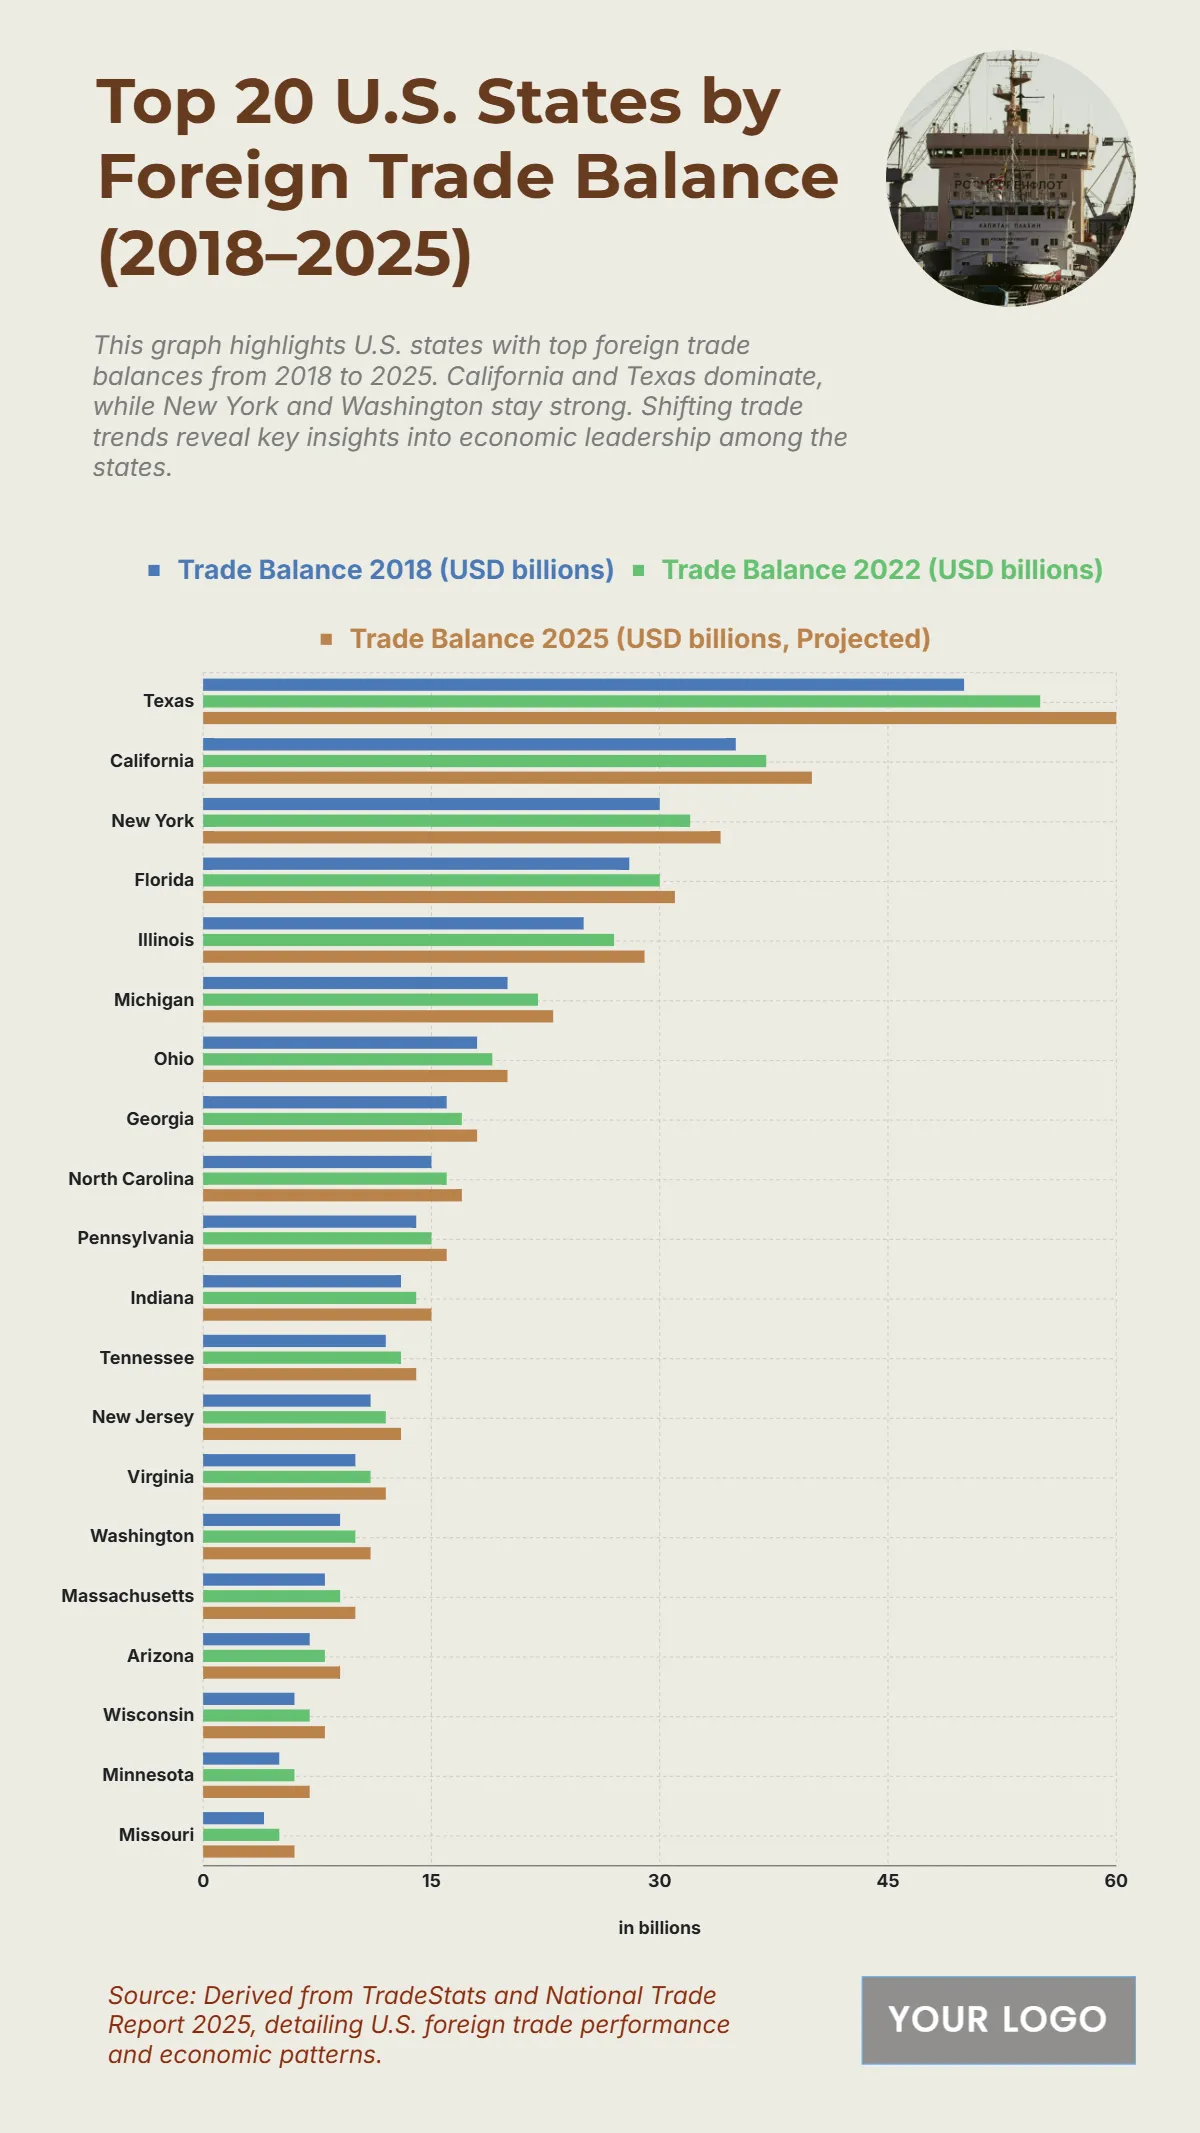
Free Top 20 U.S. States by Foreign Trade Balance (2018–2025) Chart
The chart presents the progression of foreign trade balances across major U.S. states from 2018 to 2025, reflecting strong trade activity and projected economic growth. Texas leads throughout the years, increasing from $50 billion in 2018 to $55 billion in 2022 and is projected to reach $60 billion by 2025. California follows with $35 billion in 2018, $37 billion in 2022, and a projected $40 billion in 2025. New York rises from $30 billion to $34 billion, maintaining a strong trade presence. Florida and Illinois show solid growth, reaching $31 billion and $29 billion by 2025, respectively. States such as Michigan, Ohio, and Georgia also demonstrate upward trends, with Michigan increasing from $20 billion to $23 billion. Even smaller trade states like Washington, Massachusetts, and Arizona show gradual gains, underlining widespread trade activity growth across regions.
| Labels | Trade Balance 2018 (USD billions) | Trade Balance 2022 (USD billions) | Trade Balance 2025 (USD billions, Projected) |
|---|---|---|---|
| Texas | 50 | 55 | 60 |
| California | 35 | 37 | 40 |
| New York | 30 | 32 | 34 |
| Florida | 28 | 30 | 31 |
| Illinois | 25 | 27 | 29 |
| Michigan | 20 | 22 | 23 |
| Ohio | 18 | 19 | 20 |
| Georgia | 16 | 17 | 18 |
| North Carolina | 15 | 16 | 17 |
| Pennsylvania | 14 | 15 | 16 |
| Indiana | 13 | 14 | 15 |
| Tennessee | 12 | 13 | 14 |
| New Jersey | 11 | 12 | 13 |
| Virginia | 10 | 11 | 12 |
| Washington | 9 | 10 | 11 |
| Massachusetts | 8 | 9 | 10 |
| Arizona | 7 | 8 | 9 |


