Free U.S. Top 10 States by Cost of Utilities (2020–2025) Chart
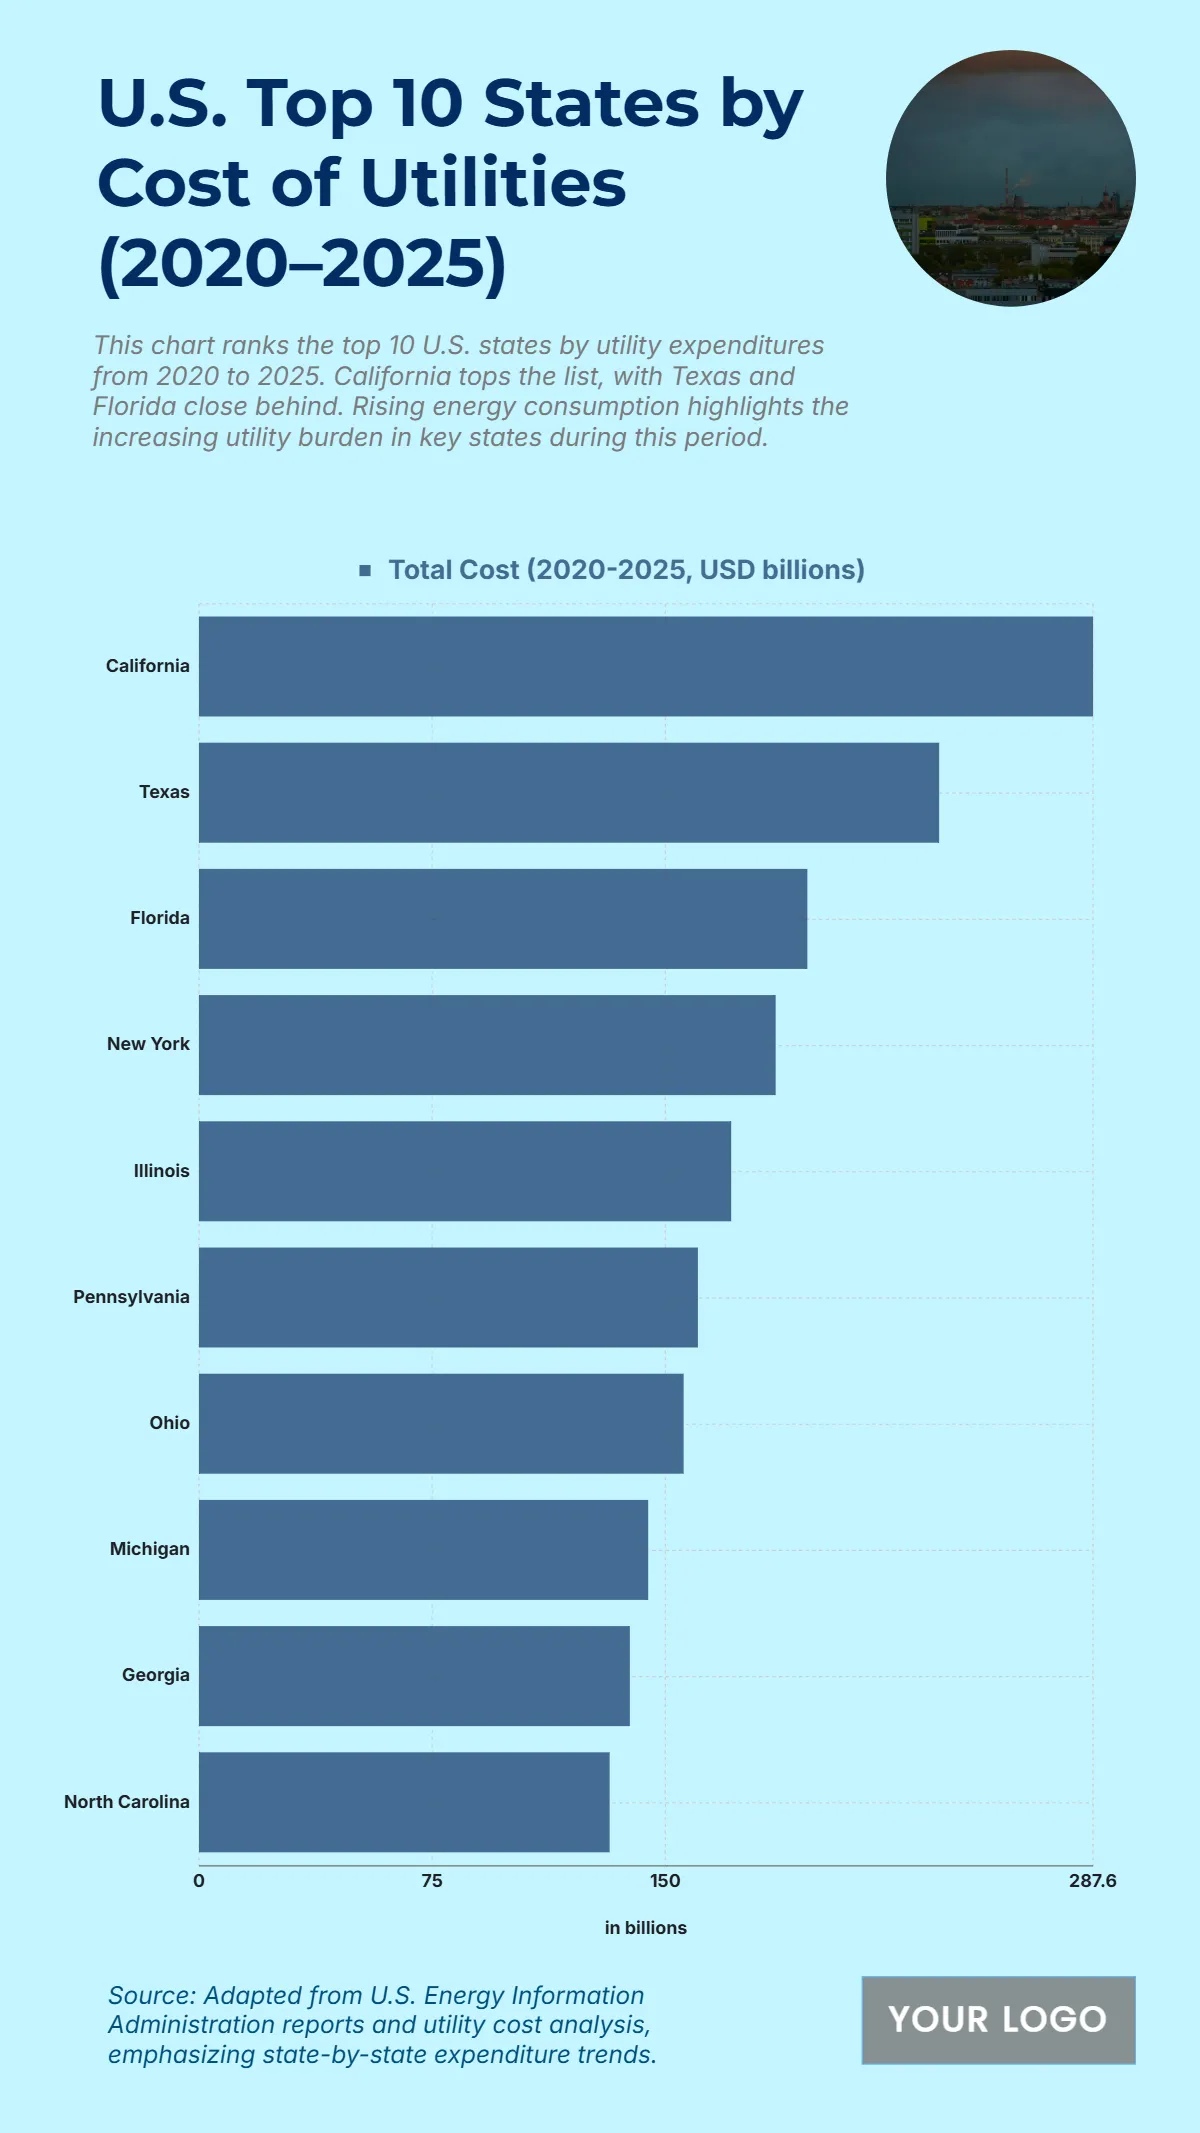
The chart outlines the total cost of utilities from 2020 to 2025, highlighting the states with the highest energy expenditure. California records the largest utility costs at $287.6 billion, reflecting its large population, extensive infrastructure, and high energy consumption. Texas follows with $238.1 billion, underscoring its rapid growth and high power demand. Florida comes next at $195.7 billion, showing significant consumption driven by population and climate factors. New York records $185.5 billion, emphasizing its urban energy requirements. Mid-level states like Illinois and Pennsylvania register $171.2 billion and $160.5 billion, respectively, reflecting consistent but moderate energy expenditures. Ohio reaches $155.9 billion, while Michigan contributes $144.5 billion. Southern states such as Georgia at $138.6 billion and North Carolina at $132.1 billion also show notable energy usage growth. This data highlights the concentrated utility spending in economically active and densely populated states.
| Labels | Total Cost (2020–2025, USD billions) |
|---|---|
| California | 287.6 |
| Texas | 238.1 |
| Florida | 195.7 |
| New York | 185.5 |
| Illinois | 171.2 |
| Pennsylvania | 160.5 |
| Ohio | 155.9 |
| Michigan | 144.5 |
| Georgia | 138.6 |
| North Carolina | 132.1 |


