Free Top 10 States by Total Renewable Energy Generation (2018–2025) Chart
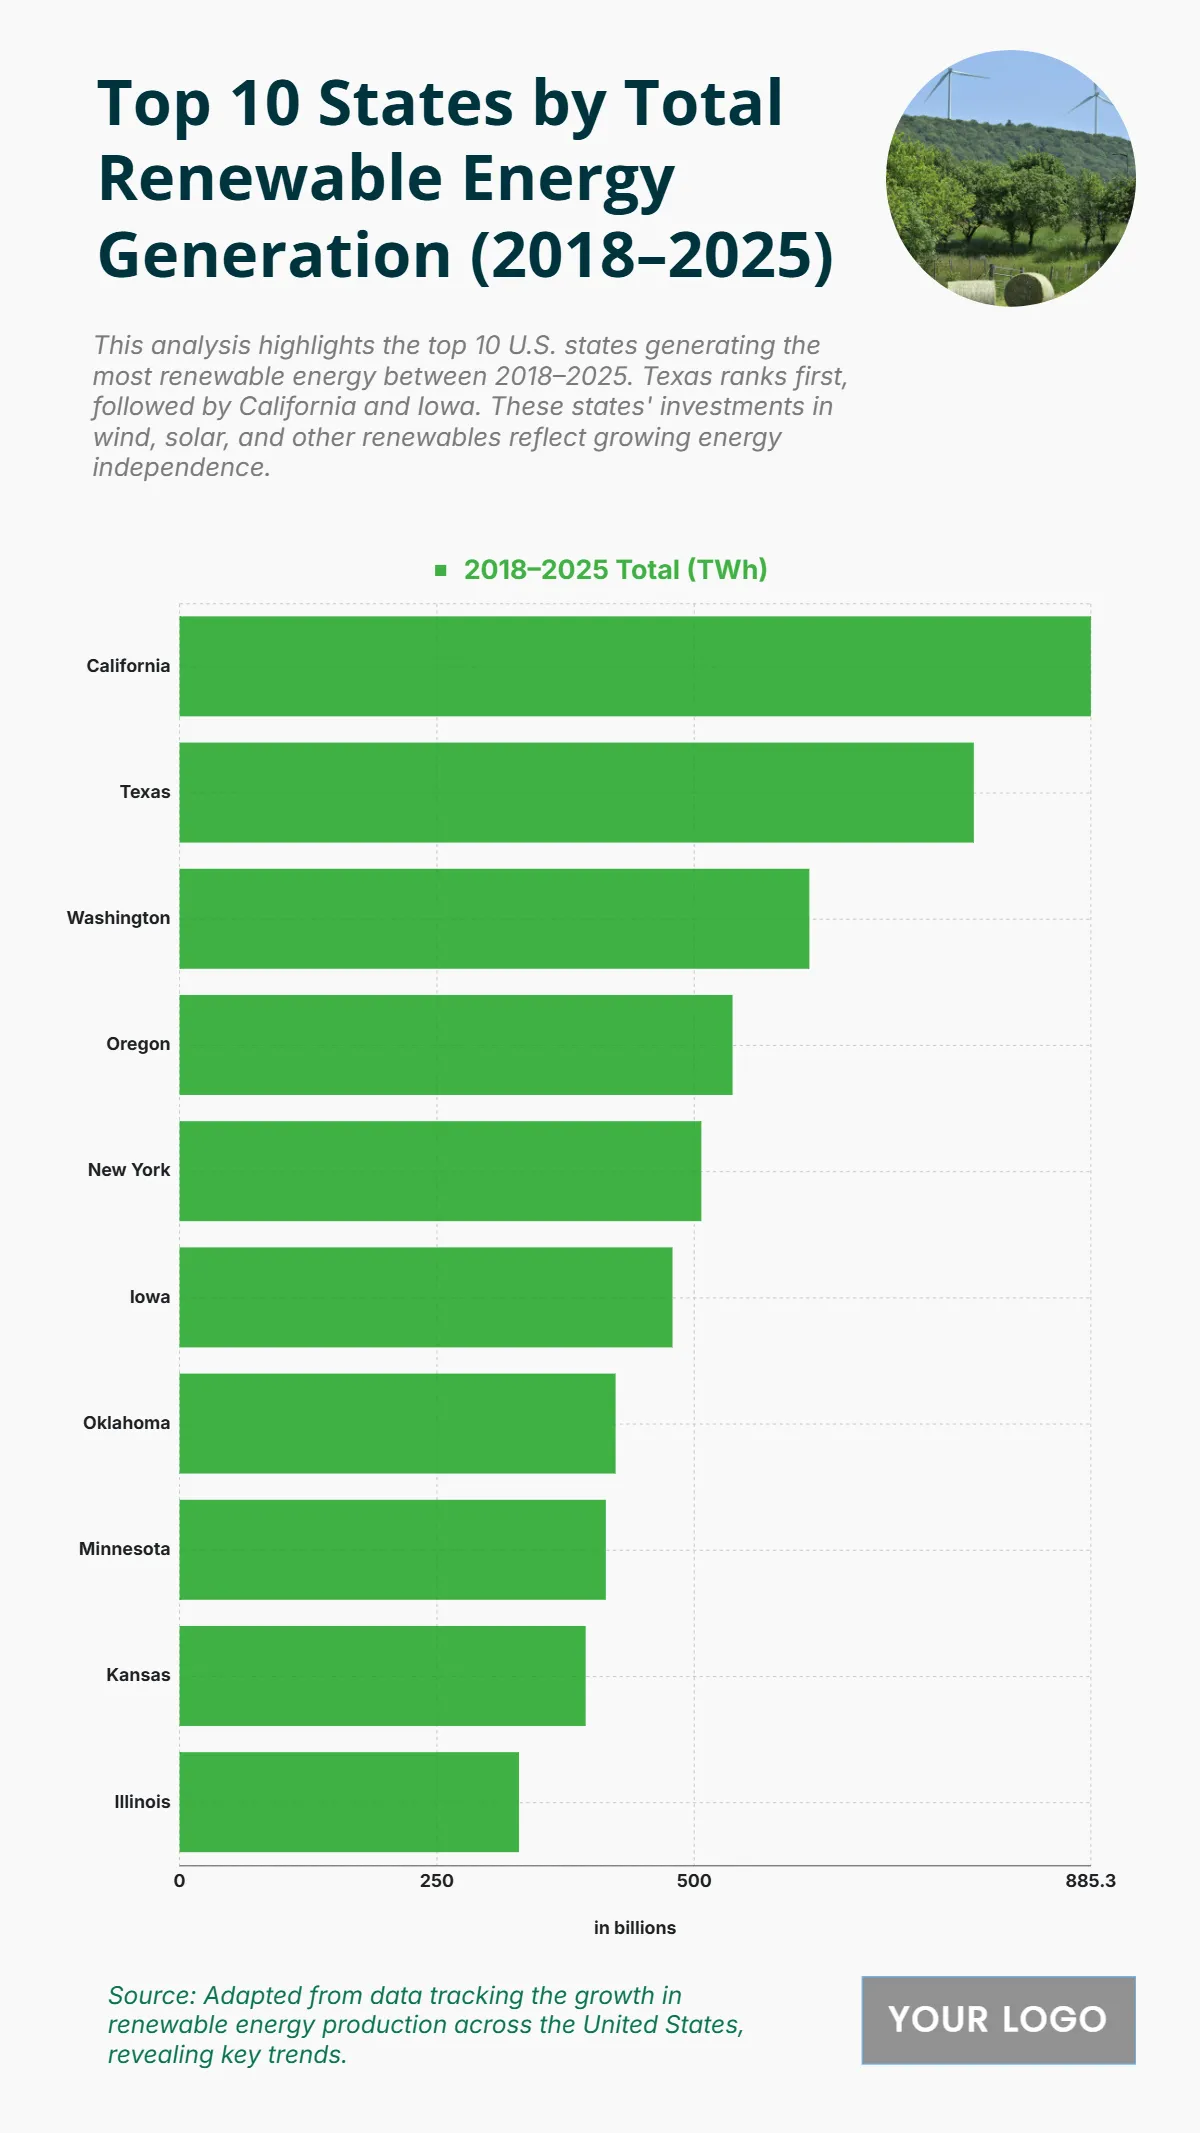
The chart reveals the total renewable energy generation from 2018 to 2025, highlighting states leading the U.S. in clean energy output. California stands at the top with a remarkable 885.3 TWh, underscoring its strong investments in solar, wind, and other renewable sources. Texas follows with 771.6 TWh, showcasing significant growth in wind energy infrastructure. Washington ranks third with 611.8 TWh, reflecting its extensive hydroelectric capacity. Oregon and New York contribute 537.2 TWh and 506.9 TWh, respectively, showing their steady commitment to renewable energy development. Iowa generates 478.9 TWh, demonstrating its leadership in wind power. Meanwhile, states like Oklahoma, Minnesota, and Kansas produce 423.6 TWh, 414.1 TWh, and 394.5 TWh, indicating their growing roles in the national clean energy mix. Illinois rounds out the top 10 with 329.7 TWh, reflecting its consistent output. Collectively, these figures emphasize a strong upward trajectory in renewable energy adoption across key states.
| Labels | 2018–2025 Total (TWh) |
|---|---|
| California | 885.3 |
| Texas | 771.6 |
| Washington | 611.8 |
| Oregon | 537.2 |
| New York | 506.9 |
| Iowa | 478.9 |
| Oklahoma | 423.6 |
| Minnesota | 414.1 |
| Kansas | 394.5 |
| Illinois | 329.7 |


