Free Top 20 U.S. States by Average Mortgage Interest Rates (2020–2025) Chart
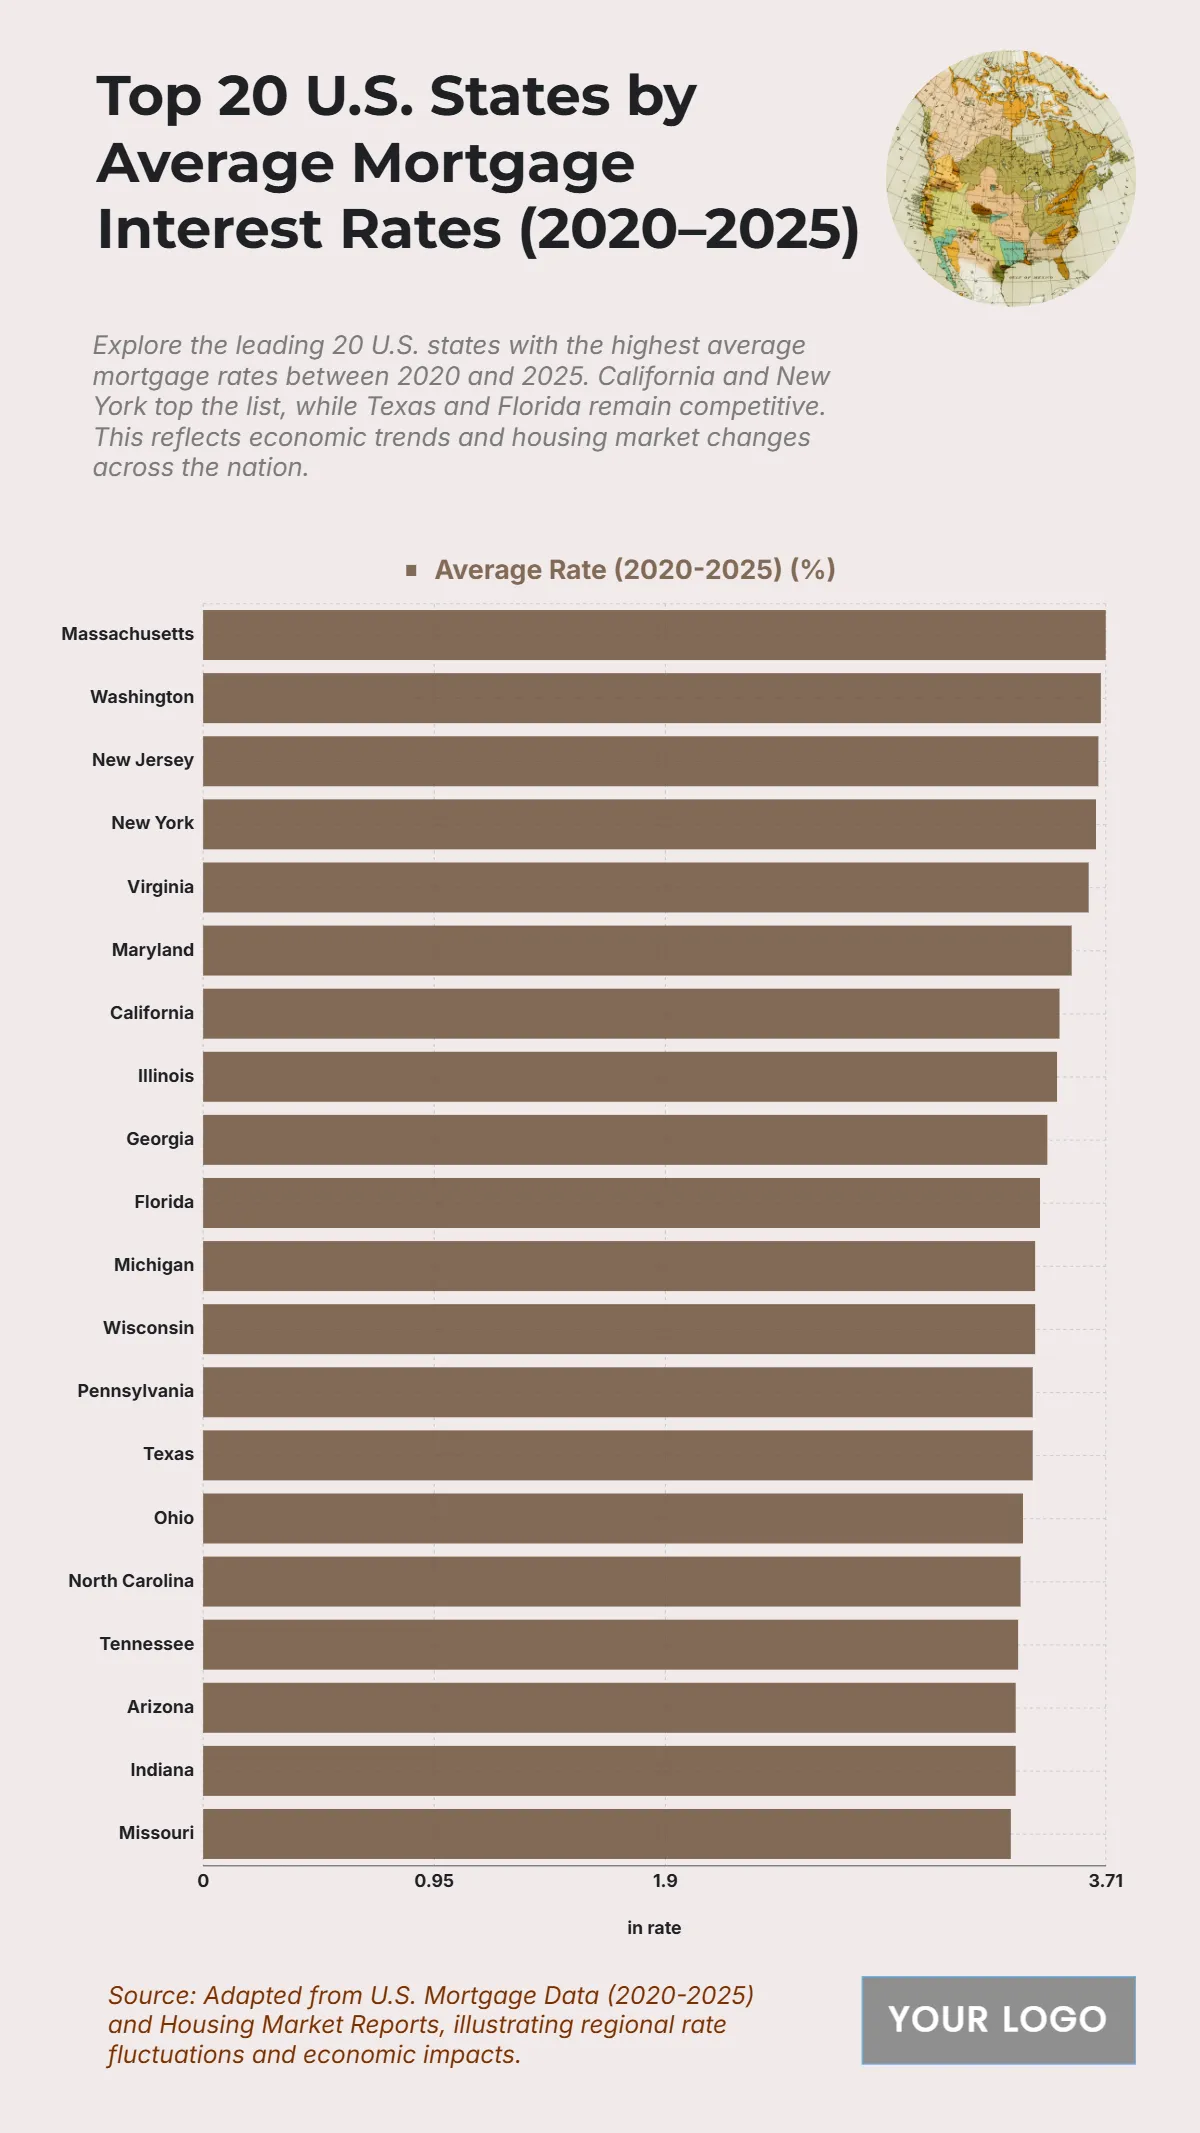
The chart shows the states with the highest average mortgage interest rates between 2020 and 2025, indicating notable differences in regional housing markets. Massachusetts leads with the highest average rate of 3.71%, closely followed by Washington at 3.69% and New Jersey at 3.68%, highlighting more expensive borrowing conditions in these areas. New York and Virginia also register elevated rates of 3.67% and 3.64%, respectively, reflecting their competitive but costly real estate markets. Mid-tier states like Maryland (3.57%), California (3.52%), and Illinois (3.51%) indicate strong mortgage demand contributing to steady rates. Meanwhile, states with slightly lower averages such as Texas (3.41%), Ohio (3.37%), and Tennessee (3.35%) reflect comparatively more affordable lending environments. This variation in mortgage rates underscores regional economic trends and housing affordability differences, which can influence buyer demand, property investment, and long-term housing growth across the U.S.
| Labels | Average Rate (2020–2025) % |
|---|---|
| Massachusetts | 3.71 |
| Washington | 3.69 |
| New Jersey | 3.68 |
| New York | 3.67 |
| Virginia | 3.64 |
| Maryland | 3.57 |
| California | 3.52 |
| Illinois | 3.51 |
| Georgia | 3.47 |
| Florida | 3.44 |
| Michigan | 3.42 |
| Wisconsin | 3.42 |
| Pennsylvania | 3.41 |
| Texas | 3.41 |
| Ohio | 3.37 |
| North Carolina | 3.36 |
| Tennessee | 3.35 |


