Free Top 10 U.S. States by Household Wealth Distribution Rate (2018-2025) Chart
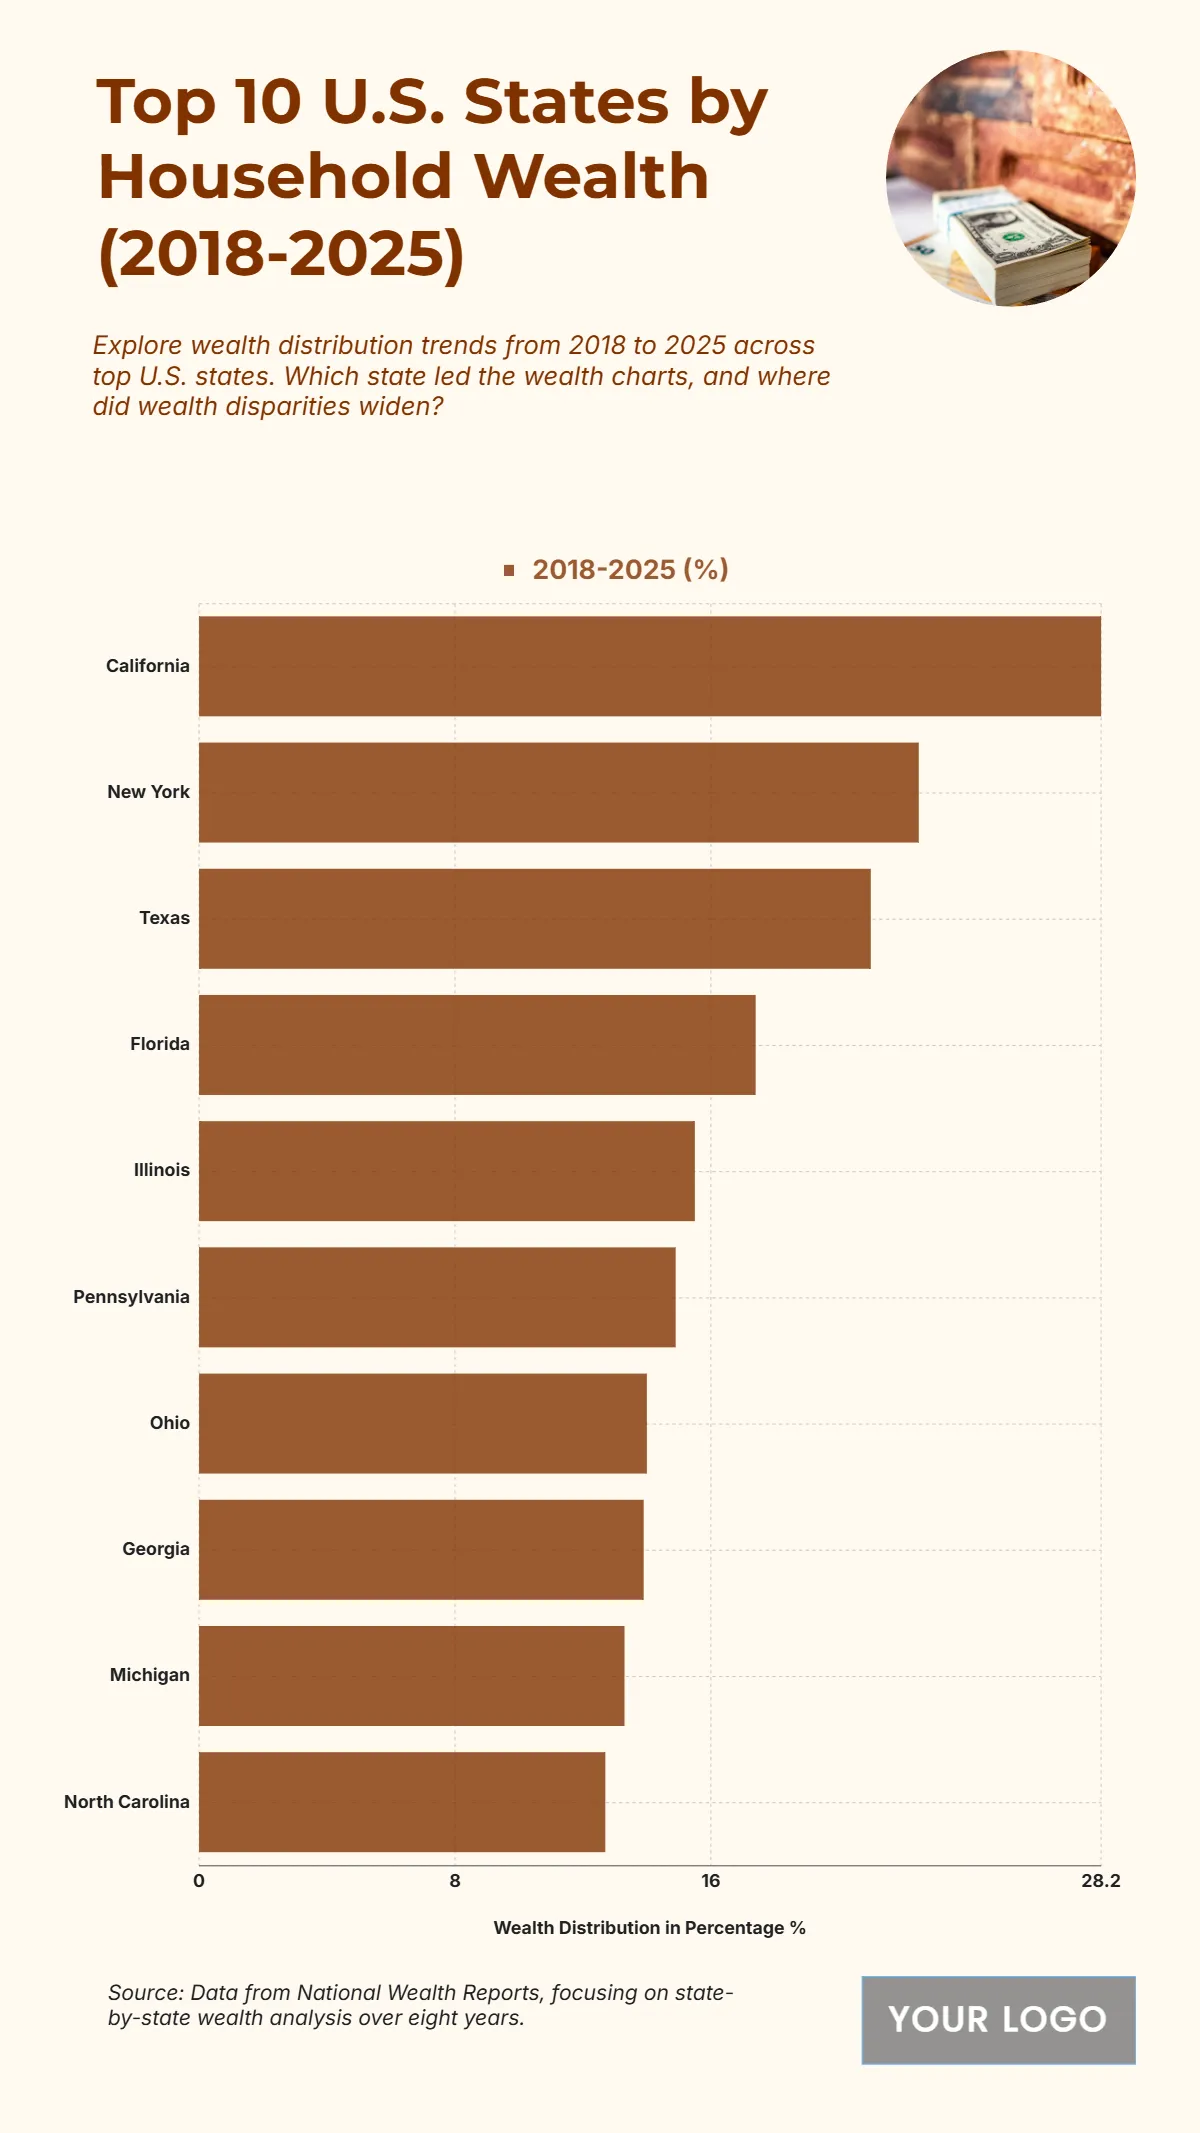
The chart titled “Top 10 U.S. States by Household Wealth (2018–2025)” illustrates wealth distribution trends among leading states over eight years. California holds the top position with the highest household wealth share at approximately 28%, reflecting its dominant economy and high-value assets. New York follows with around 23%, driven by strong financial and real estate sectors. Texas ranks third at roughly 20%, supported by steady growth in energy and technology. Florida and Illinois show moderate wealth distribution near 18% and 17%, respectively. Pennsylvania and Ohio follow closely with similar percentages, while Georgia, Michigan, and North Carolina maintain balanced growth around 15–16%. Overall, the chart underscores regional economic strength, with coastal and industrial states leading the nation’s household wealth expansion from 2018 to 2025.
| Labels | 2018-2025 (%) |
| California | 28.2 |
| New York | 22.5 |
| Texas | 21 |
| Florida | 17.4 |
| Illinois | 15.5 |
| Pennsylvania | 14.9 |
| Ohio | 14 |
| Georgia | 13.9 |
| Michigan | 13.3 |
| North Carolina | 12.7 |


