Free Top 10 U.S. States by Average Mortgage Interest Rates (2018-2025) Chart
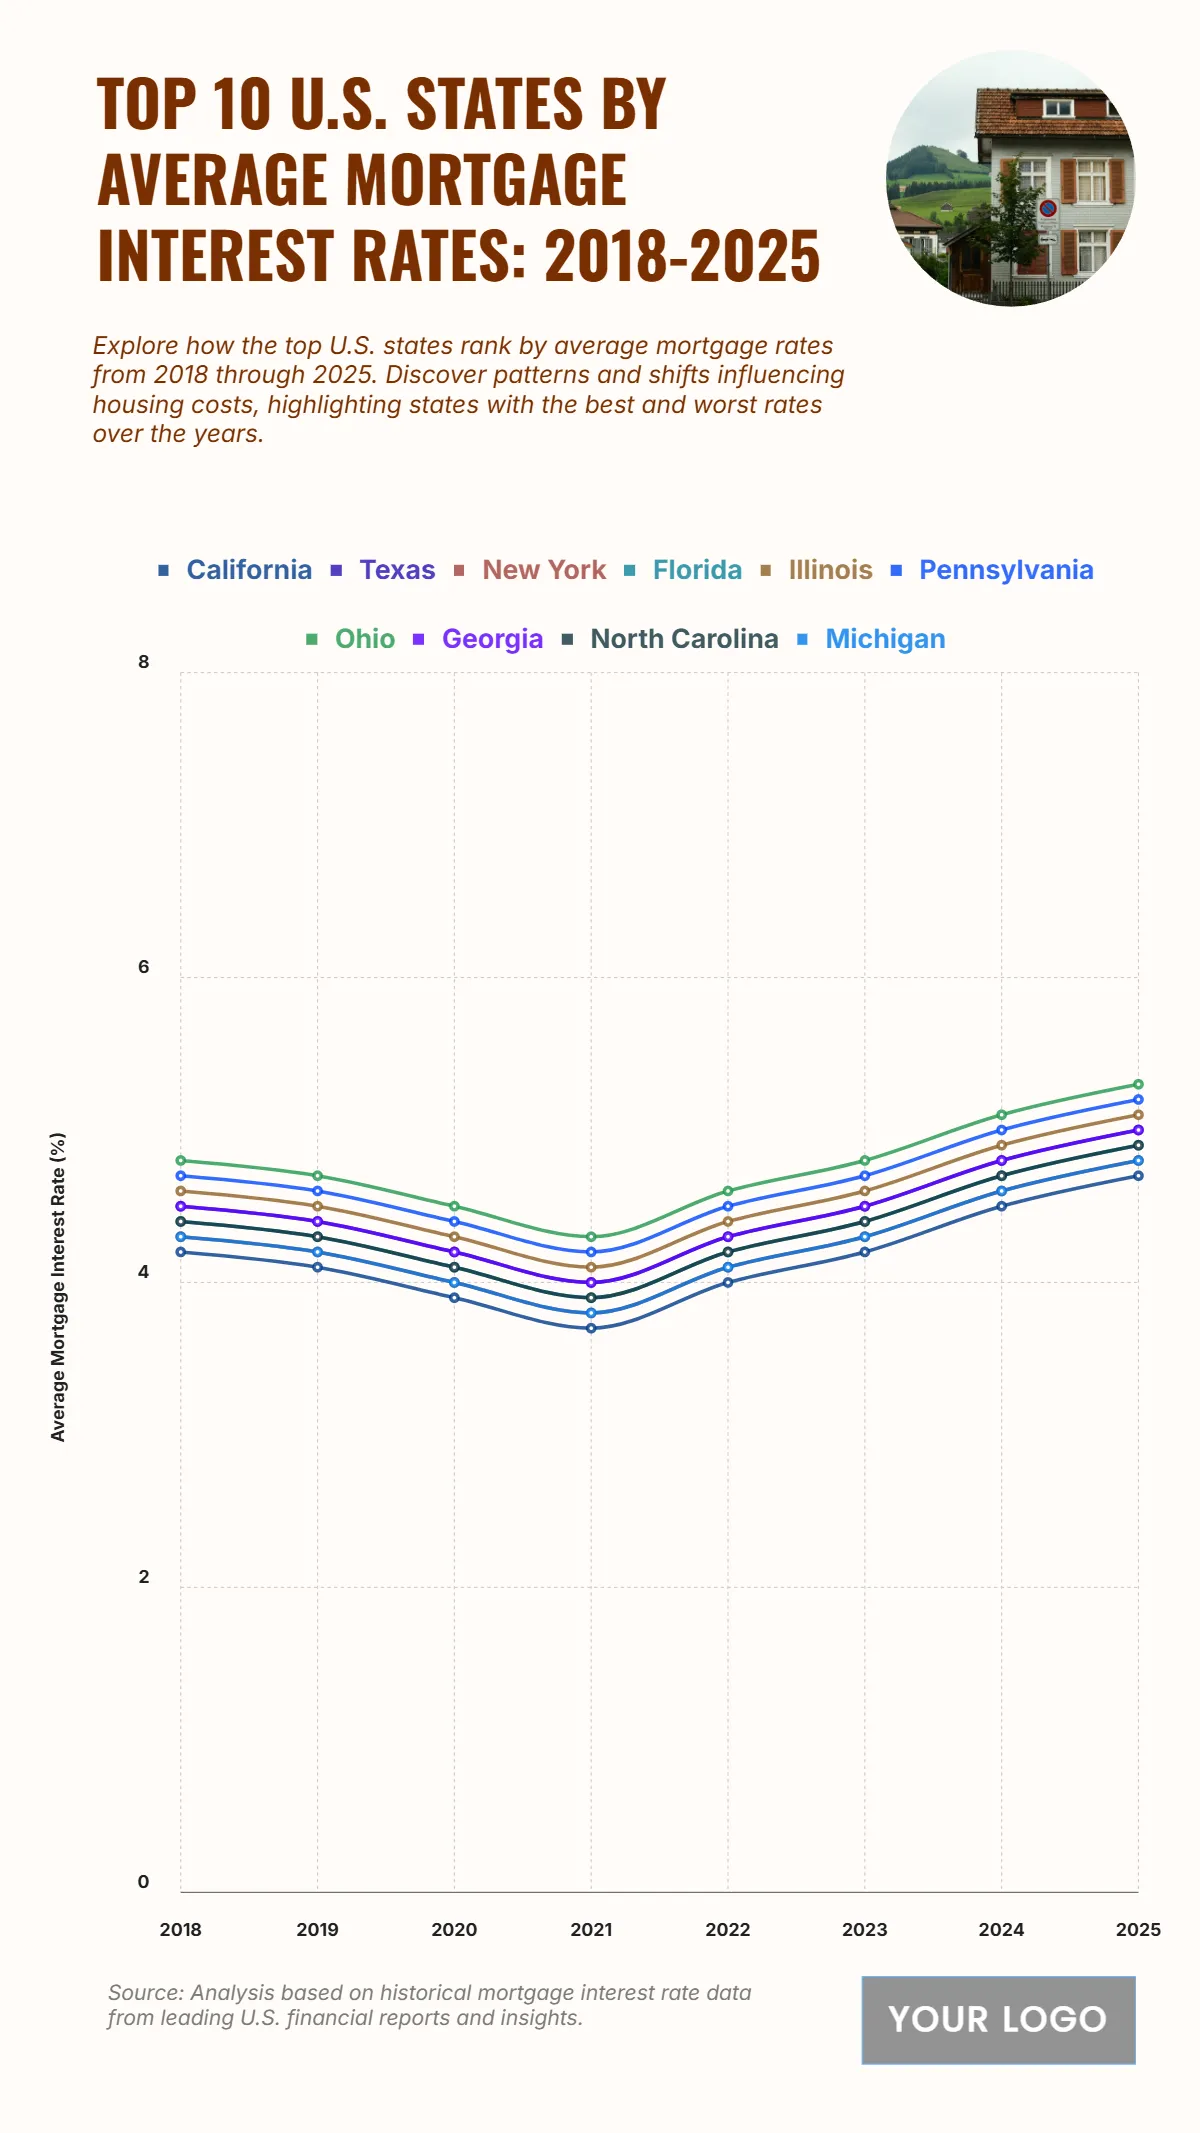
The chart titled “Top 10 U.S. States by Average Mortgage Interest Rates: 2018–2025” tracks changes in home loan rates across leading states over eight years. California and Texas show moderate fluctuations, averaging around 4.2% in 2018, dipping to roughly 3.7% in 2021, and rising again to nearly 6% by 2025. States such as New York, Florida, and Illinois follow similar trends, maintaining rates within the 4–5.8% range throughout the period. Pennsylvania and Ohio record slightly lower averages, while Georgia, North Carolina, and Michigan stay steady around 4.5–5.5%. The overall upward trend from 2021 onward reflects economic adjustments, inflationary pressures, and shifts in the U.S. housing market, marking 2025 as one of the higher mortgage rate years in recent history.
| Labels | California | Texas | New York | Florida | Illinois | Pennsylvania | Ohio | Georgia |
| 2018 | 4.2 | 4.5 | 4.3 | 4.4 | 4.6 | 4.7 | 4.8 | 4.5 |
| 2019 | 4.1 | 4.4 | 4.2 | 4.3 | 4.5 | 4.6 | 4.7 | 4.4 |
| 2020 | 3.9 | 4.2 | 4 | 4.1 | 4.3 | 4.4 | 4.5 | 4.2 |
| 2021 | 3.7 | 4 | 3.8 | 3.9 | 4.1 | 4.2 | 4.3 | 4 |
| 2022 | 4 | 4.3 | 4.1 | 4.2 | 4.4 | 4.5 | 4.6 | 4.3 |
| 2023 | 4.2 | 4.5 | 4.3 | 4.4 | 4.6 | 4.7 | 4.8 | 4.5 |
| 2024 | 4.5 | 4.8 | 4.6 | 4.7 | 4.9 | 5 | 5.1 | 4.8 |
| 2025 | 4.7 | 5 | 4.8 | 4.9 | 5.1 | 5.2 | 5.3 | 5 |


