Free Top 10 U.S. States by Residential Energy Consumption (2020-2025) Chart
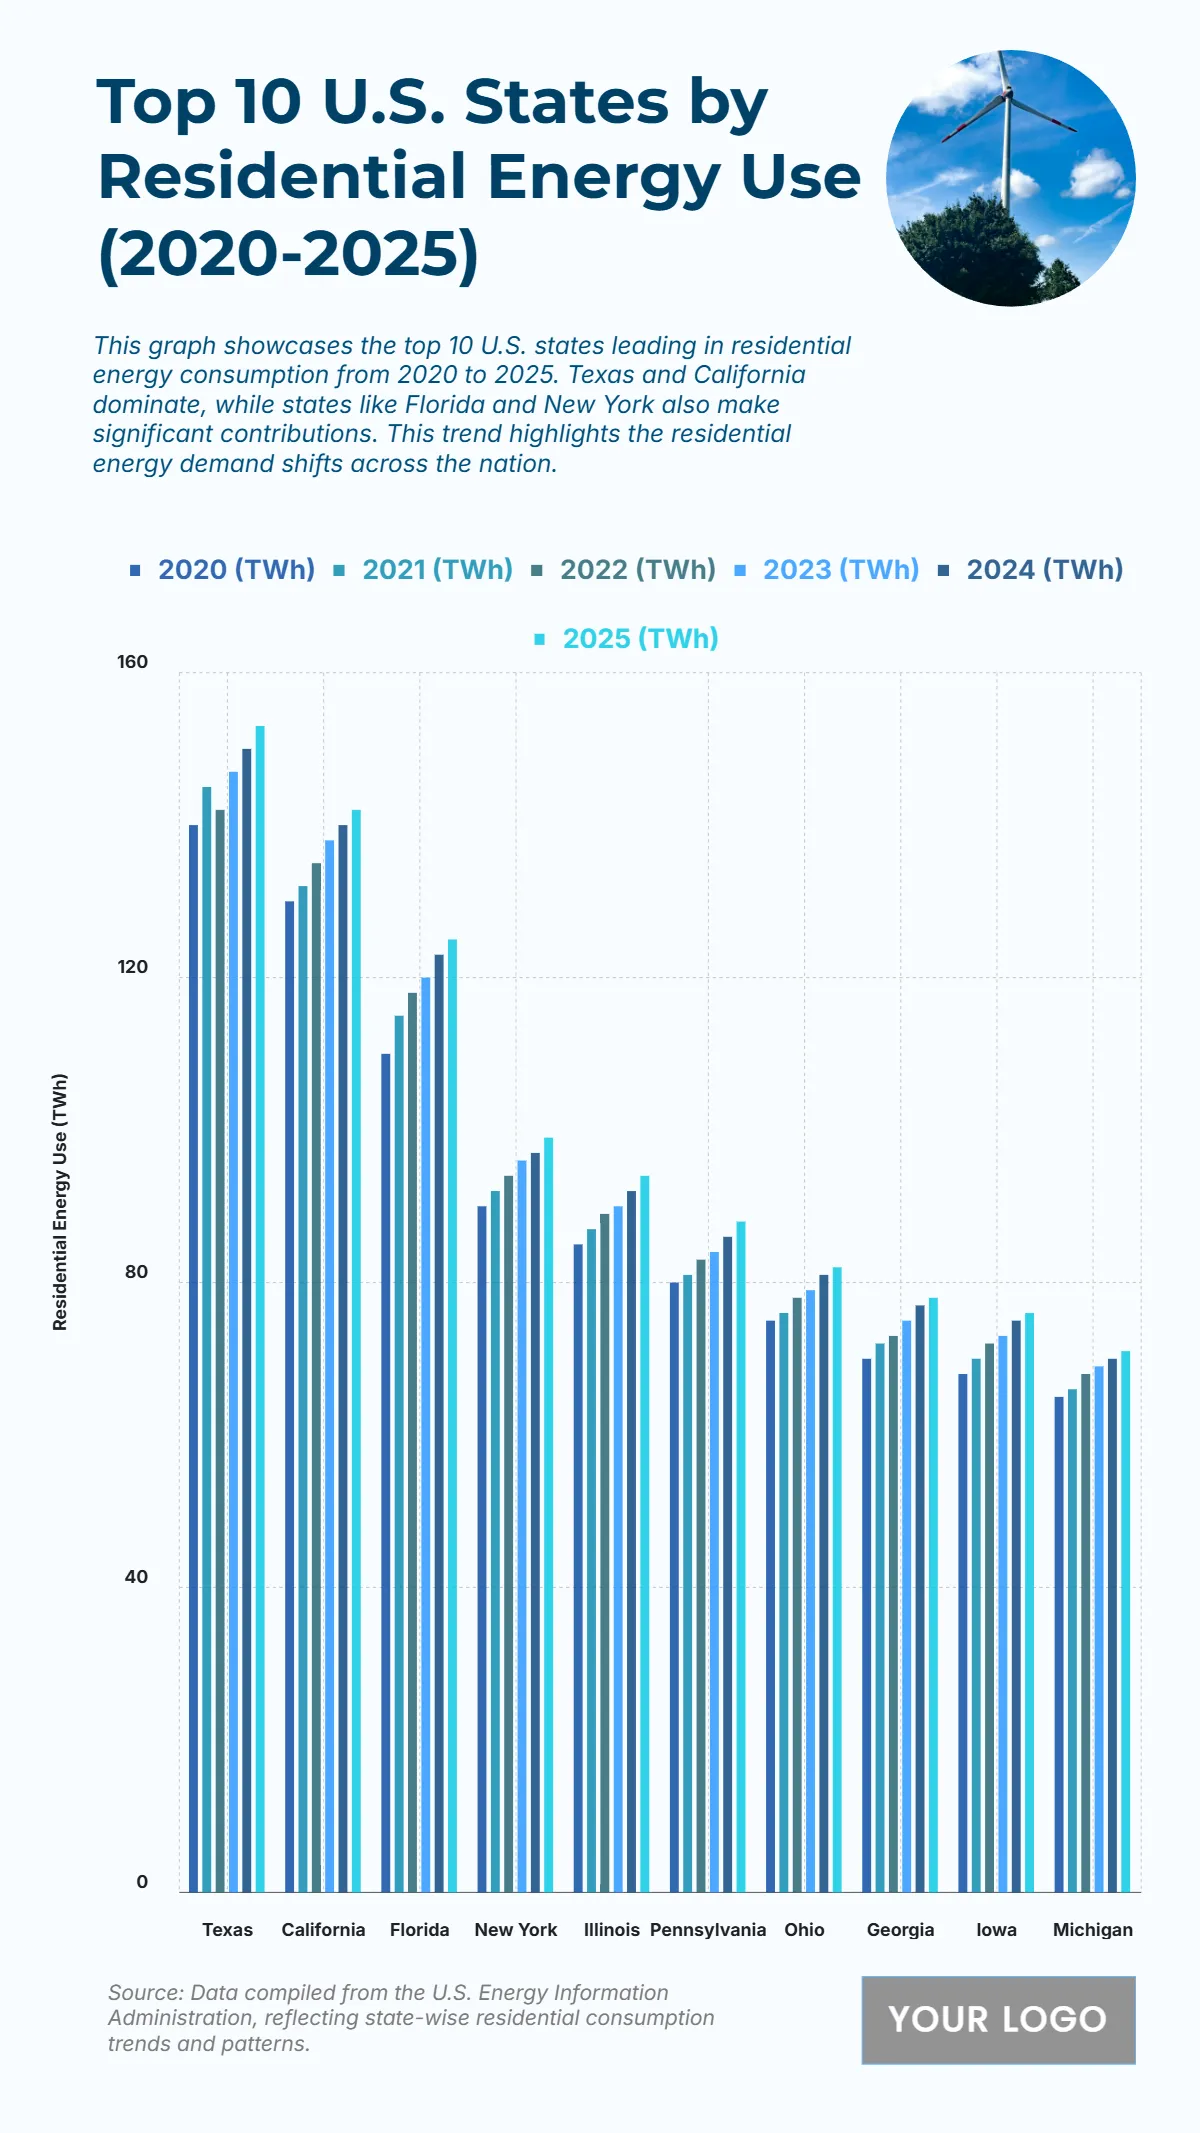
The chart titled “Top 10 U.S. States by Residential Energy Use (2020–2025)” compares household energy consumption across major states over six years. Texas leads the nation, with residential energy use climbing from about 135 TWh in 2020 to nearly 155 TWh in 2025, driven by population growth and climate-related demand. California follows with consumption rising from around 120 TWh to 140 TWh, reflecting its large housing base and renewable energy initiatives. Florida ranks third, growing from roughly 100 TWh to 120 TWh, while New York records consistent use near 95–110 TWh. Illinois, Pennsylvania, and Ohio maintain moderate levels averaging 85–95 TWh. Georgia, Iowa, and Michigan follow with figures between 70 and 85 TWh. Overall, the chart highlights rising residential energy needs across the U.S., emphasizing continued pressure on electricity infrastructure through 2025.
| Labels | 2020 (TWh) | 2021 (TWh) | 2022 (TWh) | 2023 (TWh) | 2024 (TWh) | 2025 (TWh) |
| Texas | 140 | 145 | 142 | 147 | 150 | 153 |
| California | 130 | 132 | 135 | 138 | 140 | 142 |
| Florida | 110 | 115 | 118 | 120 | 123 | 125 |
| New York | 90 | 92 | 94 | 96 | 97 | 99 |
| Illinois | 85 | 87 | 89 | 90 | 92 | 94 |
| Pennsylvania | 80 | 81 | 83 | 84 | 86 | 88 |
| Ohio | 75 | 76 | 78 | 79 | 81 | 82 |
| Georgia | 70 | 72 | 73 | 75 | 77 | 78 |
| Iowa | 68 | 70 | 72 | 73 | 75 | 76 |
| Michigan | 65 | 66 | 68 | 69 | 70 | 71 |


