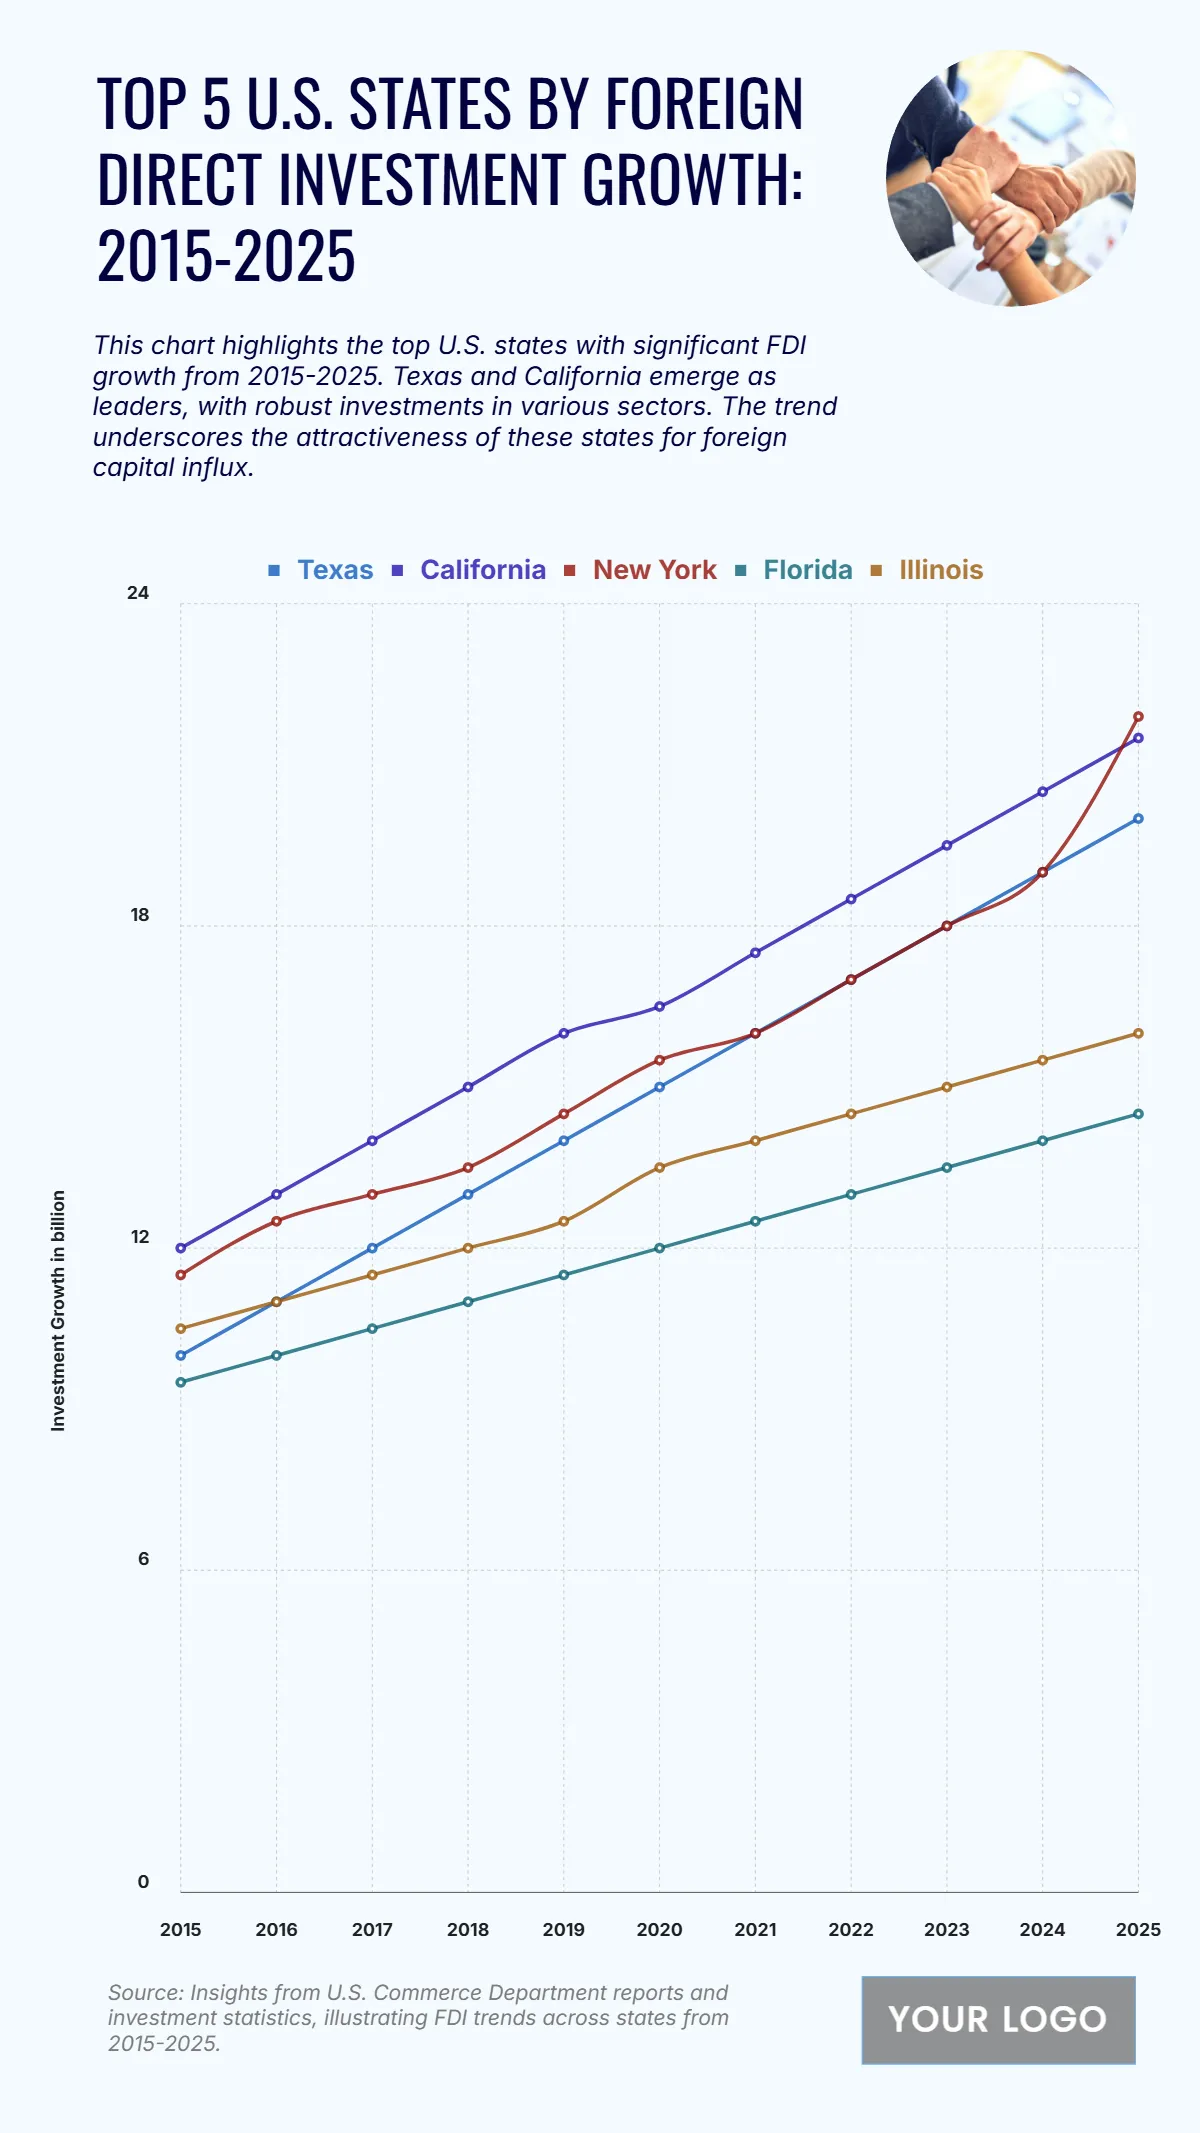
The chart titled “Top 5 U.S. States by Foreign Direct Investment Growth: 2015–2025” showcases the expansion of FDI across leading states over a decade. Texas leads with investment growth rising from around USD 10 billion in 2015 to nearly USD 23 billion by 2025, driven by its strong industrial base and business-friendly policies. California follows closely, increasing from approximately USD 11 billion to USD 22 billion, reflecting steady inflows in technology and renewable energy sectors. New York records substantial gains, climbing from about USD 12 billion to USD 21 billion during the same period. Florida and Illinois also show consistent upward trends, reaching roughly USD 17 billion and USD 15 billion respectively by 2025. Overall, the chart underscores accelerating foreign capital inflows into key U.S. states, highlighting their global competitiveness and growing appeal as investment destinations.
| Labels | Texas | California | New York | Florida | Illinois |
| 2015 | 10 | 12 | 11.5 | 9.5 | 10.5 |
| 2016 | 11 | 13 | 12.5 | 10 | 11 |
| 2017 | 12 | 14 | 13 | 10.5 | 11.5 |
| 2018 | 13 | 15 | 13.5 | 11 | 12 |
| 2019 | 14 | 16 | 14.5 | 11.5 | 12.5 |
| 2020 | 15 | 16.5 | 15.5 | 12 | 13.5 |
| 2021 | 16 | 17.5 | 16 | 12.5 | 14 |
| 2022 | 17 | 18.5 | 17 | 13 | 14.5 |
| 2023 | 18 | 19.5 | 18 | 13.5 | 15 |
| 2024 | 19 | 20.5 | 19 | 14 | 15.5 |
| 2025 | 20 | 21.5 | 21.9 | 14.5 | 16 |


