Free Top 10 U.S. States by Public vs. Private Sector Employment (2018-2025) Chart
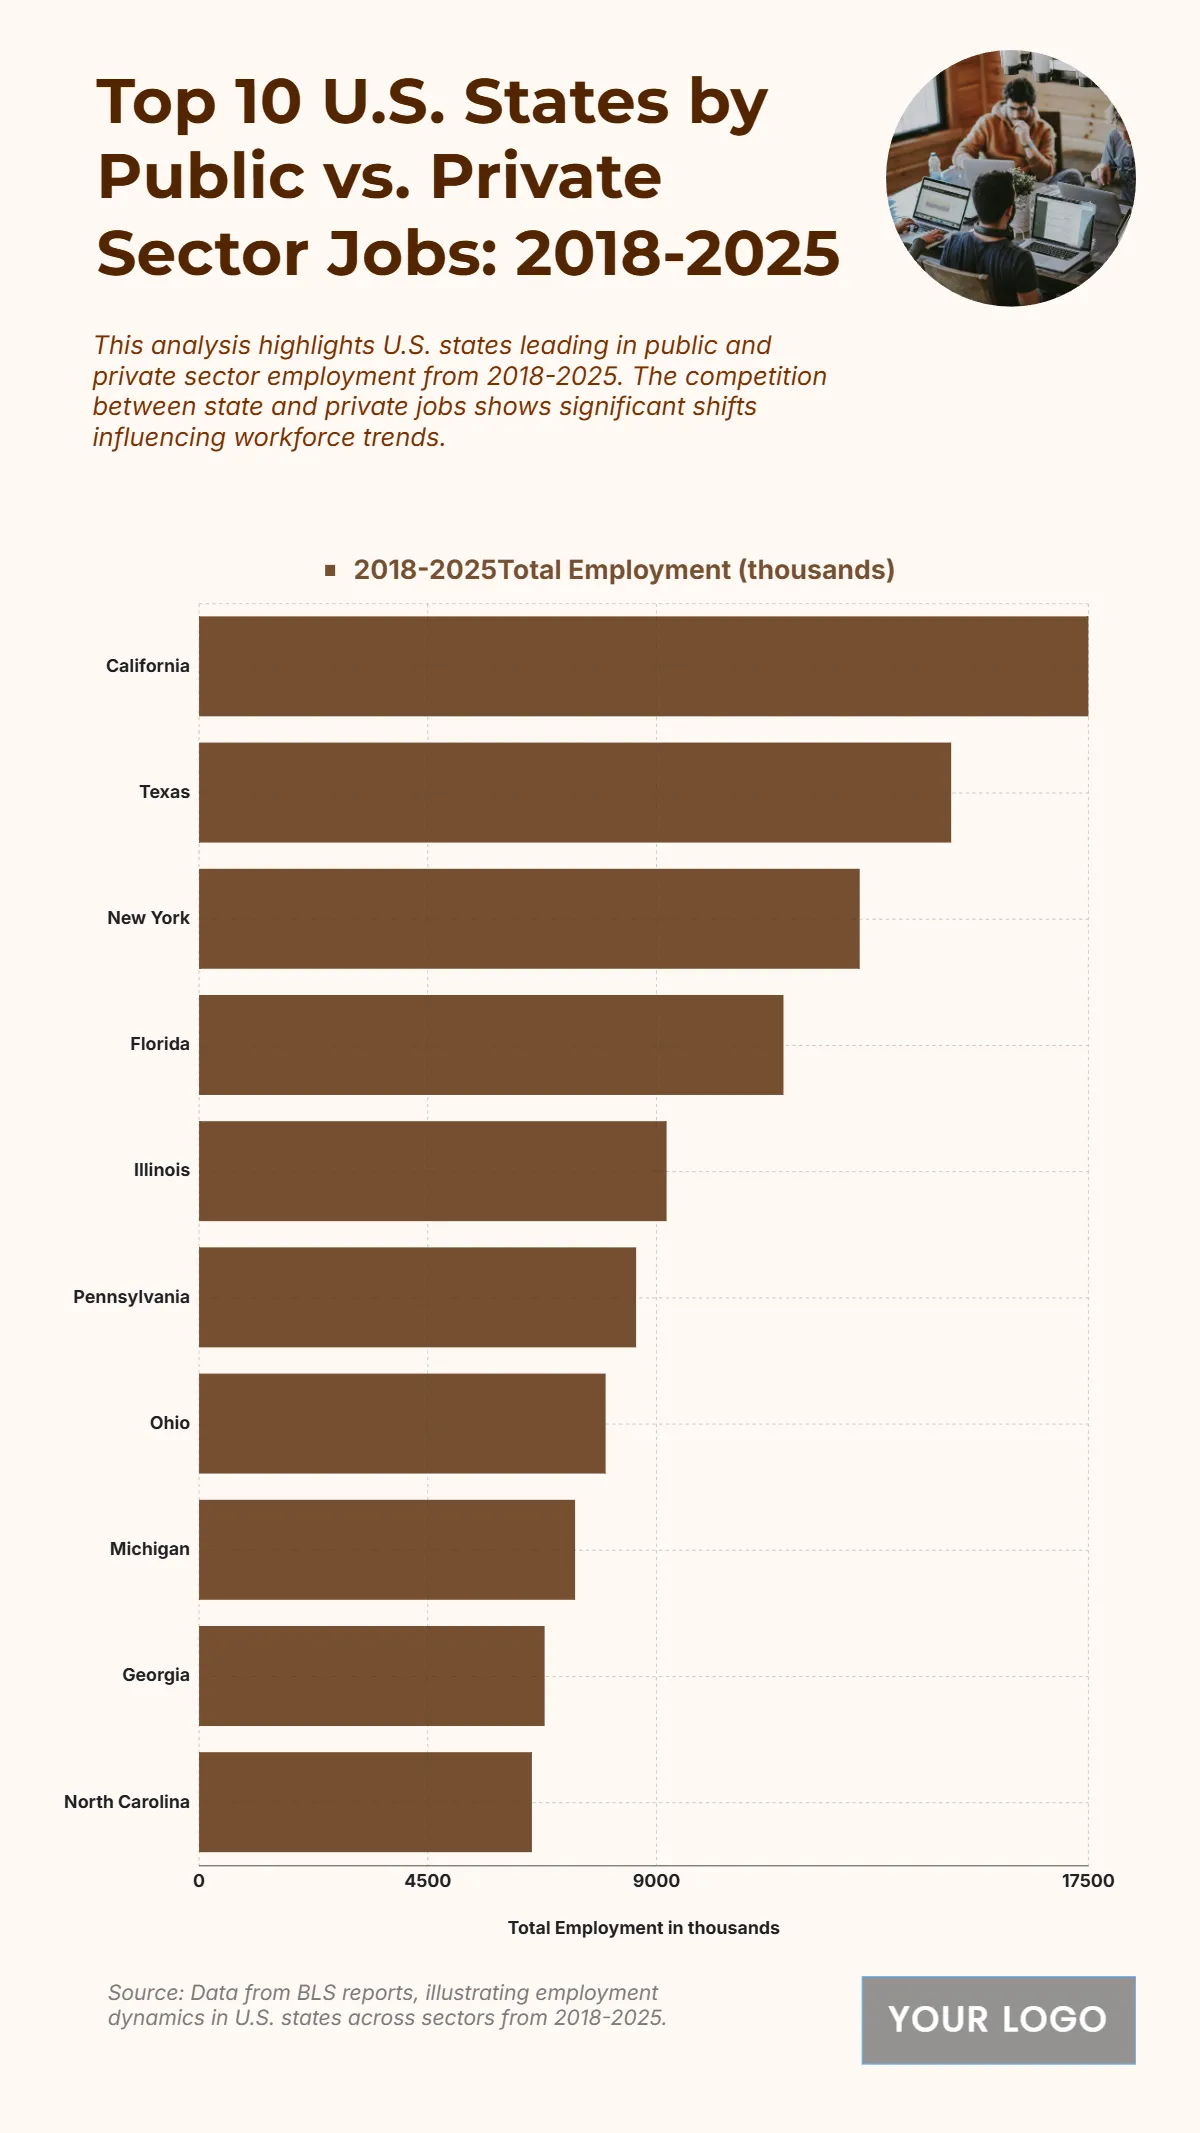
The chart titled “Top 10 U.S. States by Public vs. Private Sector Jobs: 2018–2025” illustrates employment levels across major states during the period. California leads with the highest combined public and private sector employment, reaching around 17 million jobs. Texas follows with approximately 15 million, supported by strong growth in energy, technology, and services. New York ranks third with about 13 million jobs, reflecting its diverse economy. Florida and Illinois report totals of roughly 11 million and 9 million, respectively, showing consistent workforce expansion. Pennsylvania, Ohio, Michigan, Georgia, and North Carolina each maintain between 7 and 8.5 million jobs. Overall, the data highlights sustained employment growth across key states, emphasizing the dominant role of private sector expansion alongside steady public workforce stability from 2018 to 2025.
| Labels |
2018-2025 Total Employment (thousands) |
| California | 17,500 |
| Texas | 14,800 |
| New York | 13,000 |
| Florida | 11,500 |
| Illinois | 9,200 |
| Pennsylvania | 8,600 |
| Ohio | 8,000 |
| Michigan | 7,400 |
| Georgia | 6,800 |
| North Carolina | 6,550 |


