Free Top 20 U.S. States by Agricultural Productivity (2018-2025)
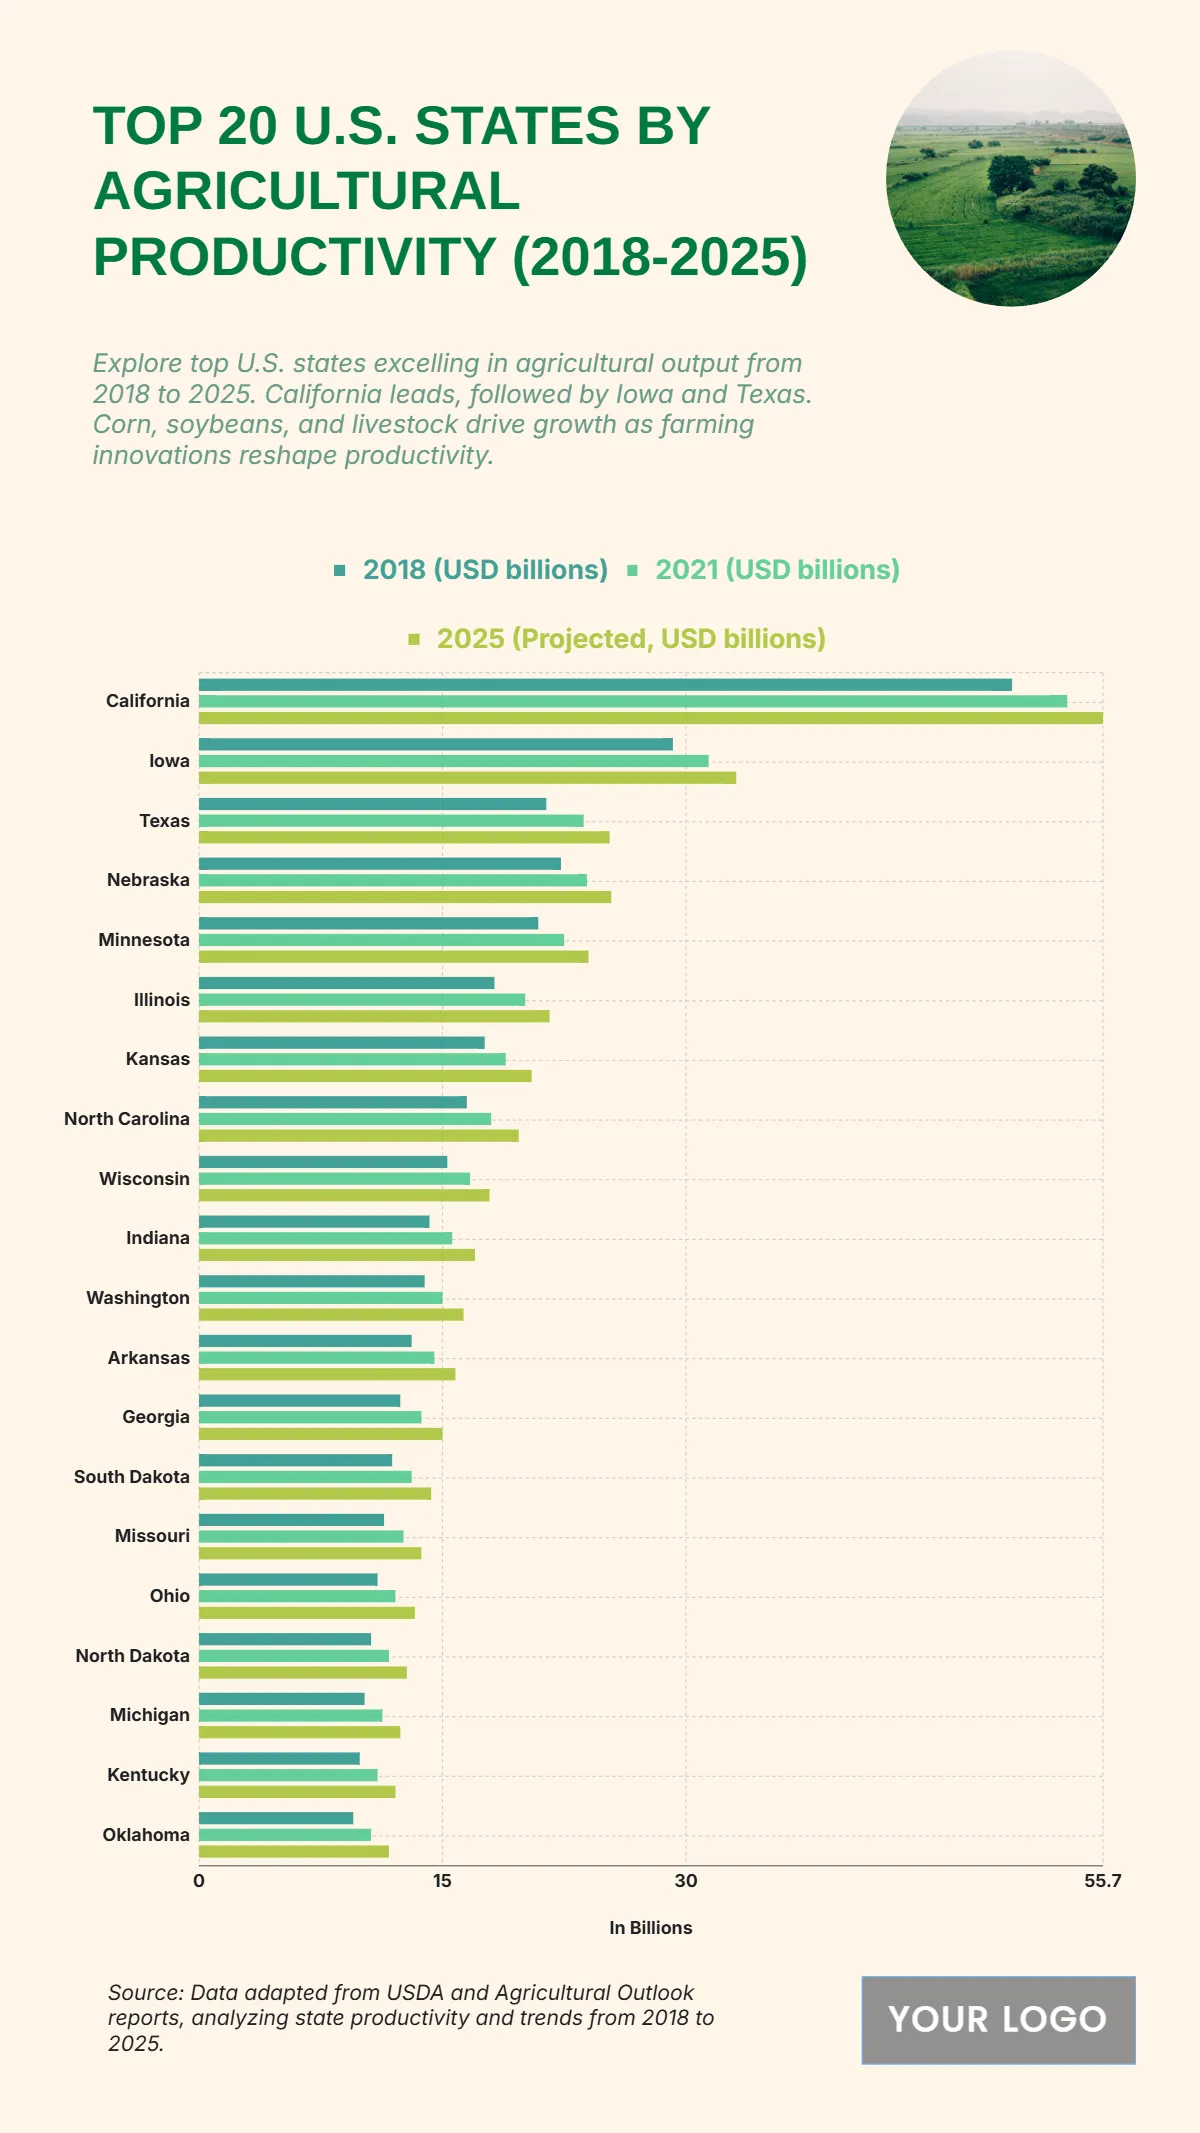
The chart shows significant growth in agricultural productivity across U.S. states from 2018 to 2025, led by California with an increase from $50.1 billion in 2018 to a projected $55.7 billion by 2025. Iowa follows closely, rising from $29.2 billion to $33.1 billion, driven by crop and livestock output. Texas also shows a notable jump from $21.4 billion to $25.3 billion, while Nebraska and Minnesota project values of $25.4 billion and $22.5 billion, respectively. Midwestern states like Illinois and Kansas also post strong figures, reaching $21.6 billion and $20.5 billion. Southern and Southeastern states such as North Carolina, Arkansas, and Georgia contribute steadily with moderate increases. Even smaller producers like Kentucky and Oklahoma exhibit gradual growth. These trends reflect advancing farming technologies, improved yields, and robust agricultural investments shaping regional economies.
| Labels | 2018 (USD billions) | 2021 (USD billions) | 2025 (Projected, USD billions) |
|---|---|---|---|
| California | 50.1 | 53.5 | 55.7 |
| Iowa | 29.2 | 31.4 | 33.1 |
| Texas | 21.4 | 23.7 | 25.3 |
| Nebraska | 22.3 | 23.9 | 25.4 |
| Minnesota | 20.9 | 22.5 | 22.5 |
| Illinois | 18.2 | 20.1 | 21.6 |
| Kansas | 17.6 | 18.9 | 20.5 |
| North Carolina | 16.5 | 18.0 | 19.7 |
| Wisconsin | 15.3 | 16.7 | 17.9 |
| Indiana | 14.2 | 15.6 | 17.0 |
| Washington | 13.9 | 15.0 | 16.4 |
| Arkansas | 13.1 | 14.5 | 15.8 |
| Georgia | 12.4 | 13.7 | 15.0 |
| South Dakota | 11.9 | 13.1 | 14.3 |
| Missouri | 11.4 | 12.6 | 13.7 |
| Ohio | 11.0 | 12.1 | 13.3 |
| North Dakota | 10.6 | 11.7 | 13.0 |
| Michigan | 10.2 | 11.3 | 12.4 |
| Kentucky | 9.9 | 11.0 | 12.1 |
| Oklahoma | 9.5 | 10.6 | 11.7 |


