Free Top 10 U.S. States with the Fastest-Growing Tech Startups (2015-2025)
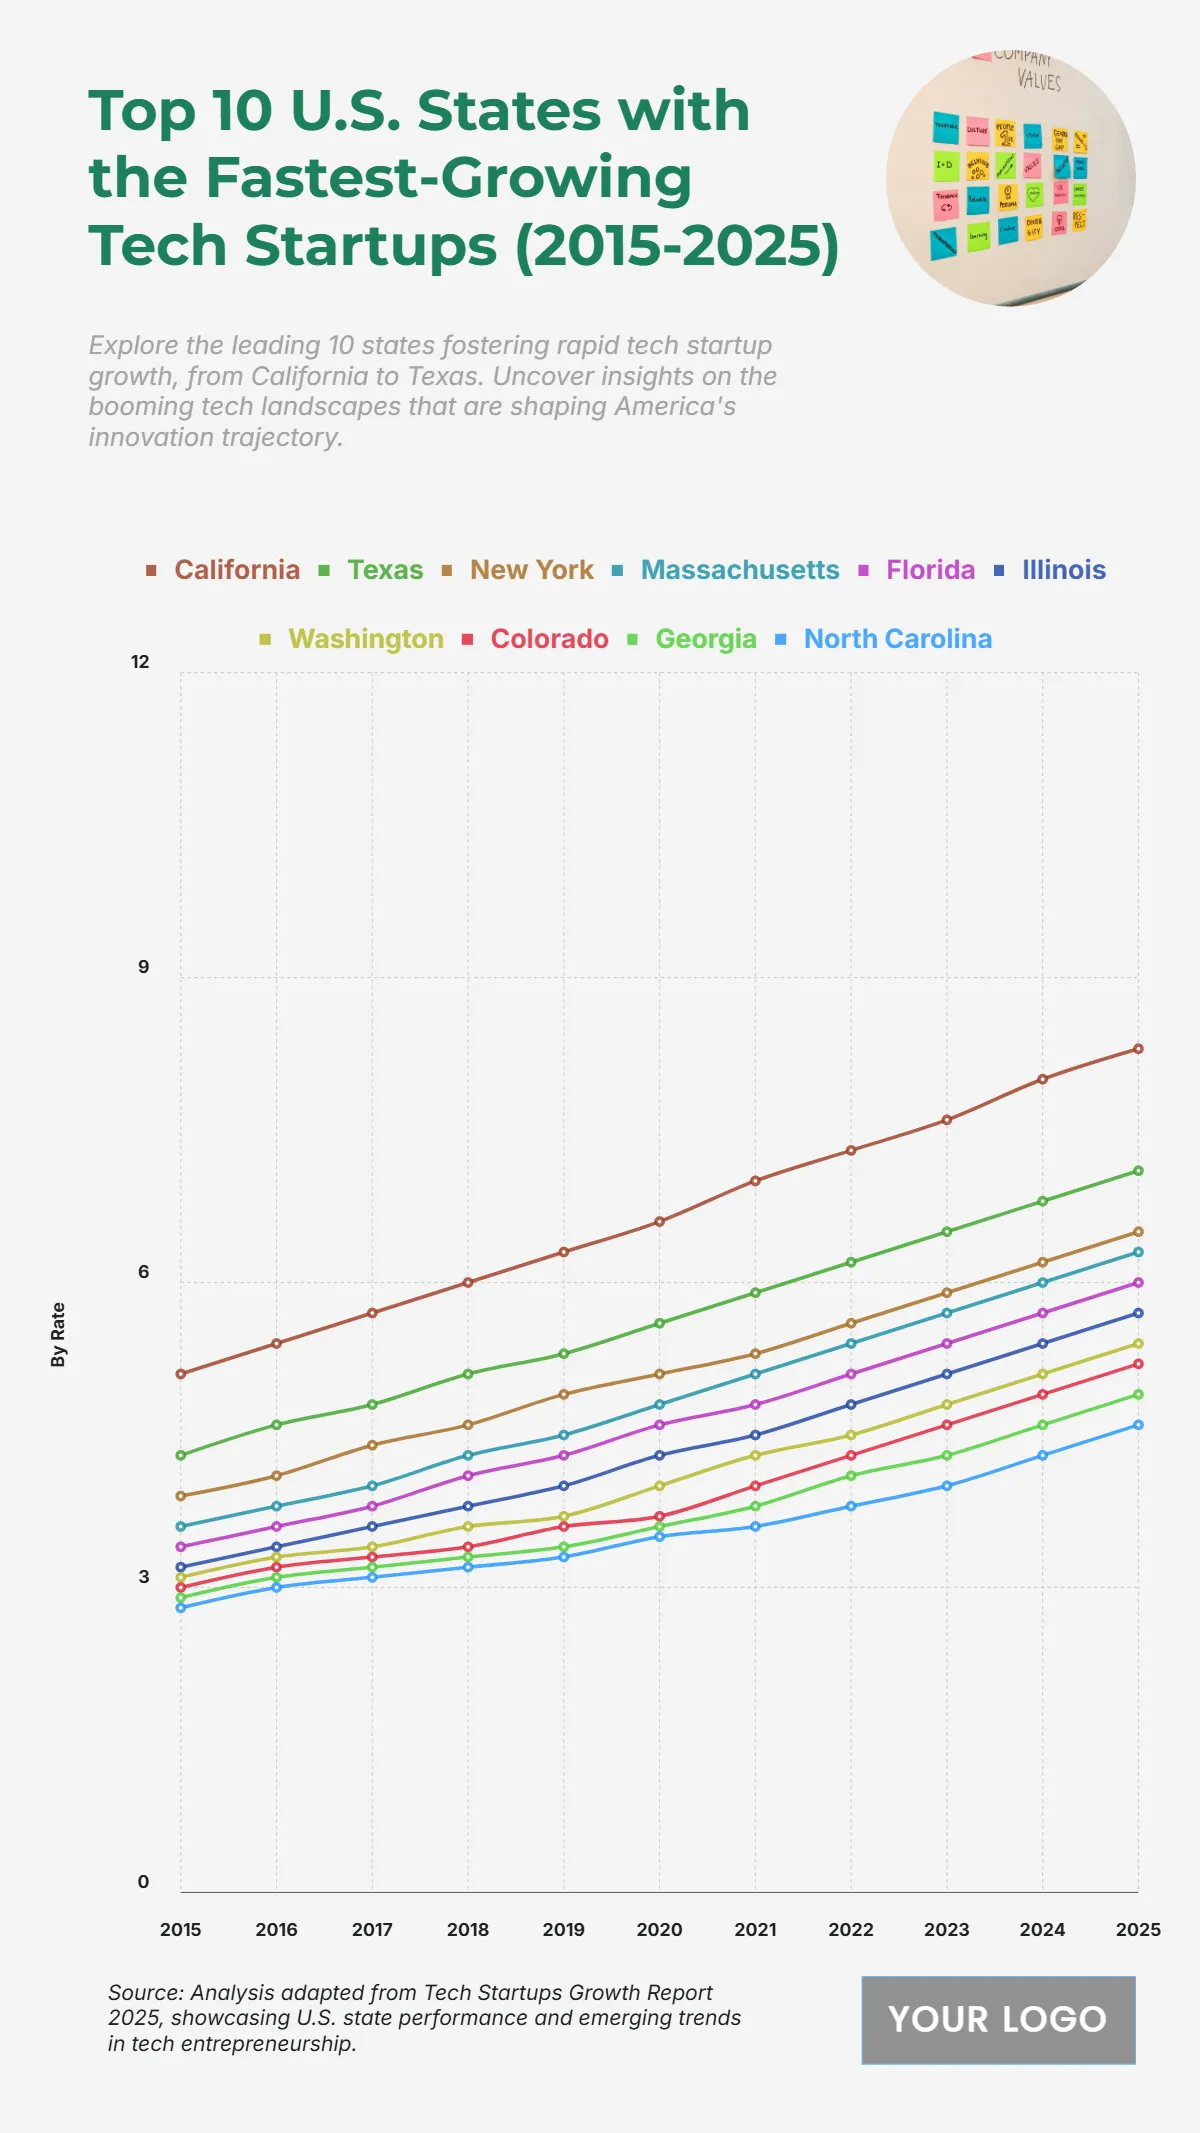
The chart showcases the strong upward trajectory of tech startup growth across major U.S. states from 2015 to 2025, with California consistently leading. The state starts at 5.1 thousand startups in 2015 and rises to 8.3 thousand by 2025, reflecting its robust innovation ecosystem. Texas follows, increasing from 4.3 to 7.1 thousand, while New York grows from 3.9 to 6.5 thousand over the same period. Massachusetts expands from 3.6 to 6.3 thousand, showcasing strong startup acceleration. Florida also grows steadily from 3.4 to 6 thousand, aligning with national tech expansion trends. Mid-tier states such as Illinois rise from 3.2 to 5.7 thousand and Washington from 3.1 to 5.4 thousand, indicating notable growth momentum. Emerging regions like Colorado, Georgia, and North Carolina show impressive climbs from 3.0, 2.9, and 2.8 thousand to 5.2, 4.9, and 4.6 thousand respectively, signaling broader geographic diversification of tech innovation across the country.
| Labels | 2015 | 2016 | 2017 | 2018 | 2019 | 2020 | 2021 | 2022 | 2023 | 2024 | 2025 |
|---|---|---|---|---|---|---|---|---|---|---|---|
| California | 5.1 | 5.4 | 5.7 | 6.0 | 6.3 | 6.6 | 7.0 | 7.3 | 7.6 | 8.0 | 8.3 |
| Texas | 4.3 | 4.6 | 4.8 | 5.1 | 5.3 | 5.6 | 5.9 | 6.2 | 6.5 | 6.8 | 7.1 |
| New York | 3.9 | 4.1 | 4.4 | 4.6 | 4.9 | 5.1 | 5.3 | 5.6 | 5.9 | 6.2 | 6.5 |
| Massachusetts | 3.6 | 3.8 | 4.0 | 4.3 | 4.5 | 4.8 | 5.1 | 5.4 | 5.7 | 6.0 | 6.3 |
| Florida | 3.4 | 3.6 | 3.8 | 4.1 | 4.3 | 4.6 | 4.8 | 5.1 | 5.4 | 5.7 | 6.0 |
| Illinois | 3.2 | 3.4 | 3.6 | 3.8 | 4.0 | 4.3 | 4.5 | 4.8 | 5.1 | 5.4 | 5.7 |
| Washington | 3.1 | 3.3 | 3.4 | 3.6 | 3.7 | 4.0 | 4.3 | 4.5 | 4.8 | 5.1 | 5.4 |
| Colorado | 3.0 | 3.2 | 3.3 | 3.4 | 3.6 | 3.9 | 4.0 | 4.3 | 4.6 | 4.9 | 5.2 |
| Georgia | 2.9 | 3.1 | 3.3 | 3.4 | 3.6 | 3.8 | 3.8 | 4.1 | 4.3 | 4.6 | 4.9 |
| North Carolina | 2.8 | 3.0 | 3.1 | 3.2 | 3.3 | 3.5 | 3.8 | 3.8 | 4.0 | 4.3 | 4.6 |


