Free Top 10 U.S. States by Total Corporate Tax Revenue (2020-2025)
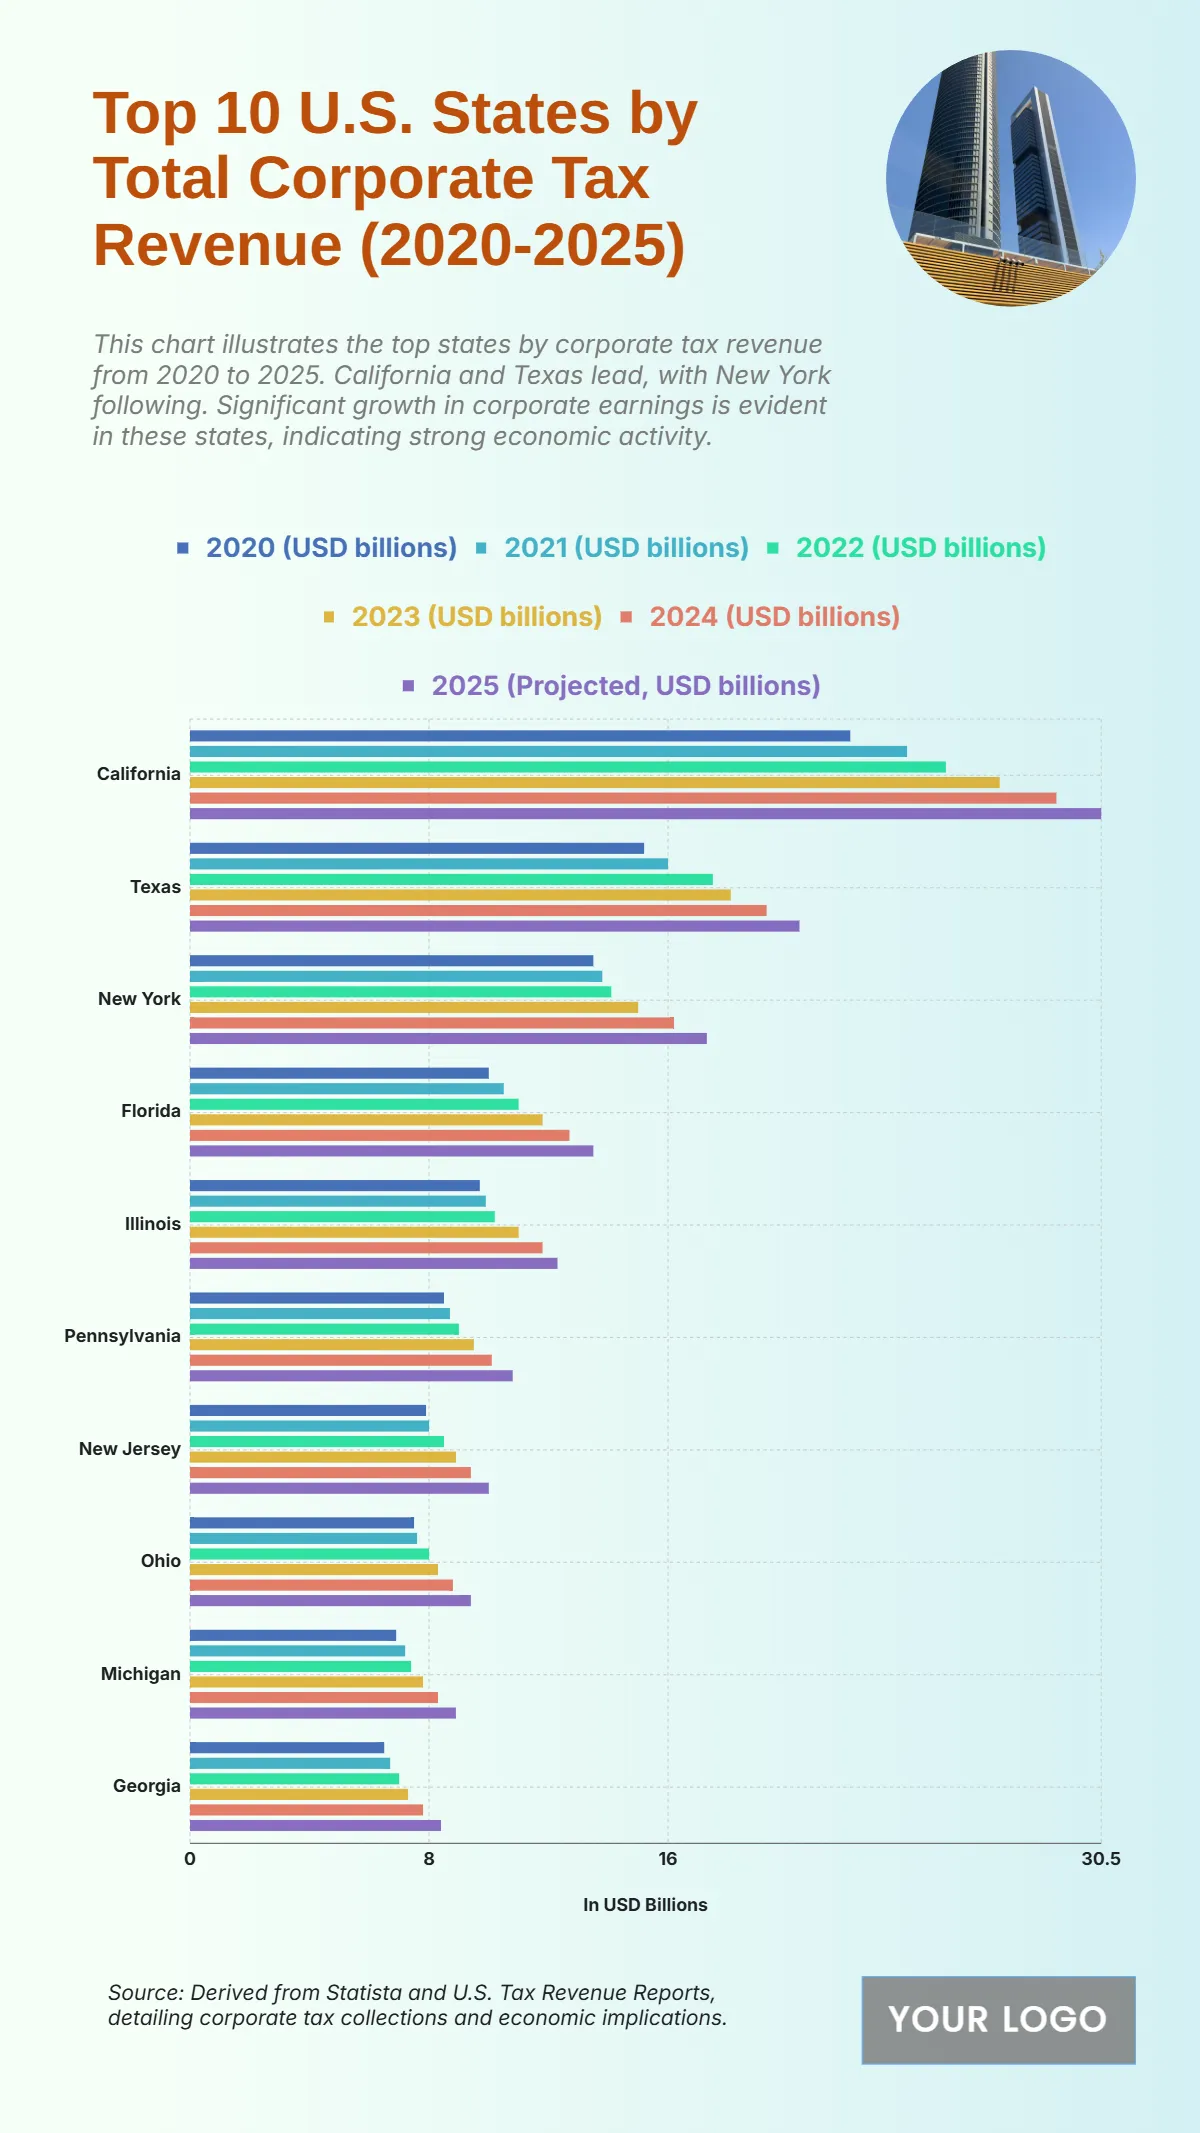
The chart highlights the upward trend in corporate tax revenue from 2020 to 2025, reflecting strong economic activity across leading U.S. states. California dominates the list, increasing from $22.1 billion in 2020 to a projected $30.5 billion in 2025, underscoring its economic strength. Texas follows, growing from $15.2 billion to $20.4 billion, supported by its rapidly expanding corporate sector. New York rises from $13.5 billion to $17.3 billion, showcasing consistent growth in corporate earnings. Florida records steady gains from $10 billion to $13.5 billion, while Illinois climbs from $9.7 billion to $12.3 billion. Mid-tier states like Pennsylvania and New Jersey progress to $10.8 billion and $10 billion respectively. Meanwhile, Ohio, Michigan, and Georgia show moderate but stable growth, each surpassing $8 billion by 2025. These figures emphasize strong fiscal performance and a broadening corporate tax base across major U.S. states.
| Labels | 2020 (USD billions) | 2021 (USD billions) | 2022 (USD billions) | 2023 (USD billions) | 2024 (USD billions) | 2025 (Projected, USD billions) |
|---|---|---|---|---|---|---|
| California | 22.1 | 24 | 25.3 | 27.1 | 29 | 30.5 |
| Texas | 15.2 | 16 | 17.5 | 18.1 | 19.3 | 20.4 |
| New York | 13.5 | 13.8 | 14.1 | 15 | 16.2 | 17.3 |
| Florida | 10 | 10.5 | 11 | 11.8 | 12.7 | 13.5 |
| Illinois | 9.7 | 9.9 | 10.2 | 11 | 11.8 | 12.3 |
| Pennsylvania | 8.5 | 8.7 | 9 | 9.5 | 10.1 | 10.8 |
| New Jersey | 7.9 | 8 | 8.5 | 8.9 | 9.4 | 10 |
| Ohio | 7.5 | 7.6 | 8 | 8.3 | 8.8 | 9.4 |
| Michigan | 6.9 | 7.2 | 7.4 | 7.8 | 8.3 | 8.9 |
| Georgia | 6.5 | 6.7 | 7 | 7.3 | 7.8 | 8.4 |


