Free Top 20 U.S. States by Total Exports (2018-2025) Chart
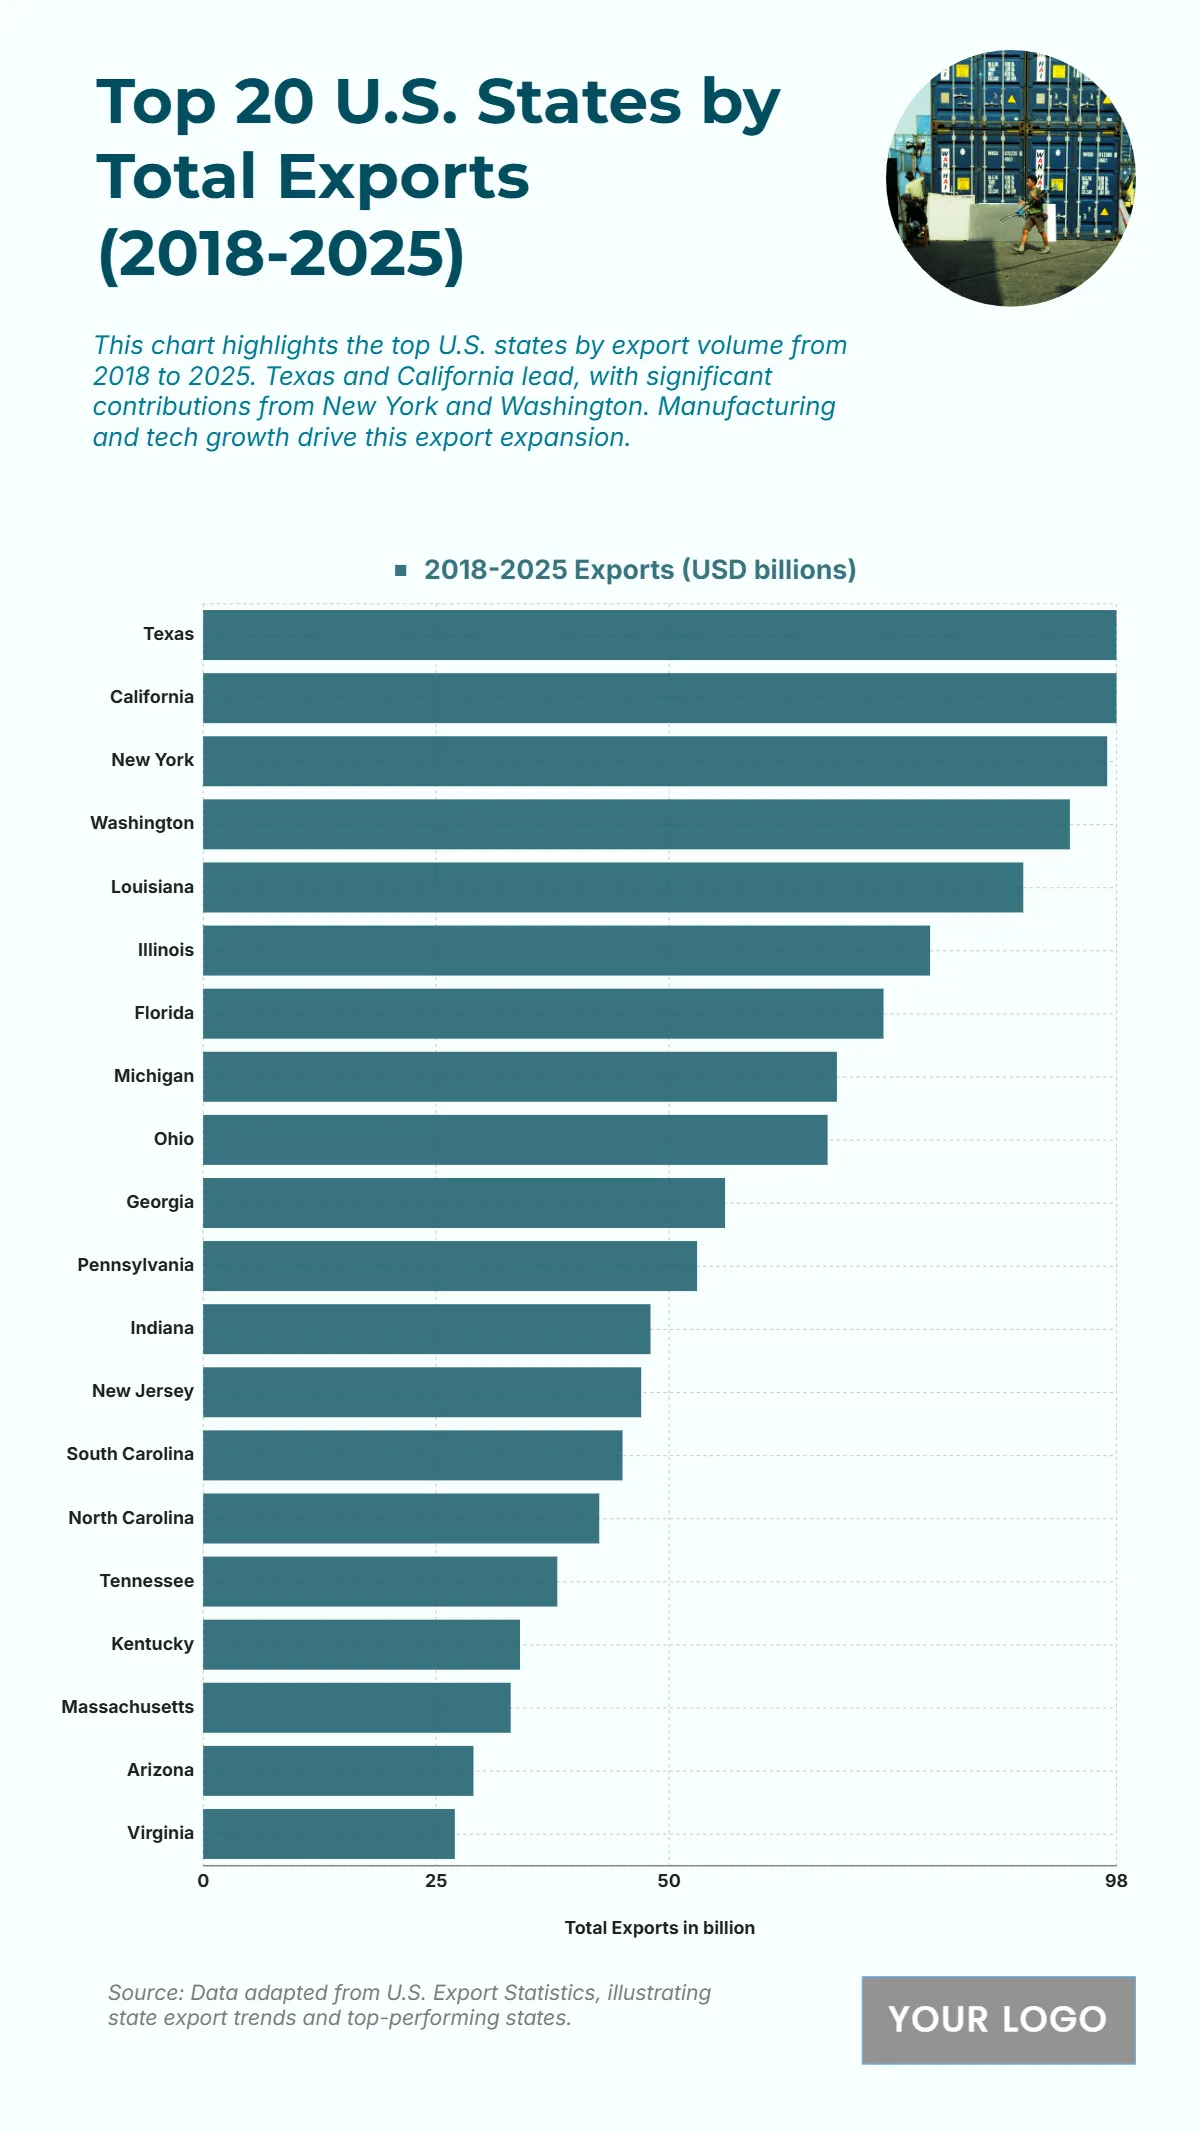
The chart reveals that Texas and California lead the U.S. in total exports between 2018 and 2025, each reaching 98 USD billion, emphasizing their dominant role in international trade. New York follows closely with 97 USD billion, supported by strong financial and manufacturing sectors. Washington holds 93 USD billion, showcasing the impact of its technology and aerospace industries. Louisiana reaches 88 USD billion, while Illinois records 78 USD billion, reflecting its strong manufacturing base. Other high-performing states include Florida with 73 USD billion, Michigan with 68 USD billion, and Ohio with 67 USD billion. Georgia stands at 56 USD billion, followed by Pennsylvania with 53 USD billion. The remaining states show consistent contributions, led by Indiana (48), New Jersey (47), South Carolina (45), North Carolina (42.5), Tennessee (38), Kentucky (34), Massachusetts (33), Arizona (29), and Virginia (27), indicating widespread export growth nationwide.
| Labels | 2018–2025 Exports (USD billions) |
|---|---|
| Texas | 98 |
| California | 98 |
| New York | 97 |
| Washington | 93 |
| Louisiana | 88 |
| Illinois | 78 |
| Florida | 73 |
| Michigan | 68 |
| Ohio | 67 |
| Georgia | 56 |
| Pennsylvania | 53 |
| Indiana | 48 |
| New Jersey | 47 |
| South Carolina | 45 |
| North Carolina | 42.5 |
| Tennessee | 38 |
| Kentucky | 34 |
| Massachusetts | 33 |
| Arizona | 29 |
| Virginia | 27 |


