Free U.S. Public Education Enrollment vs. Private Education Enrollment (2020-2025) Chart
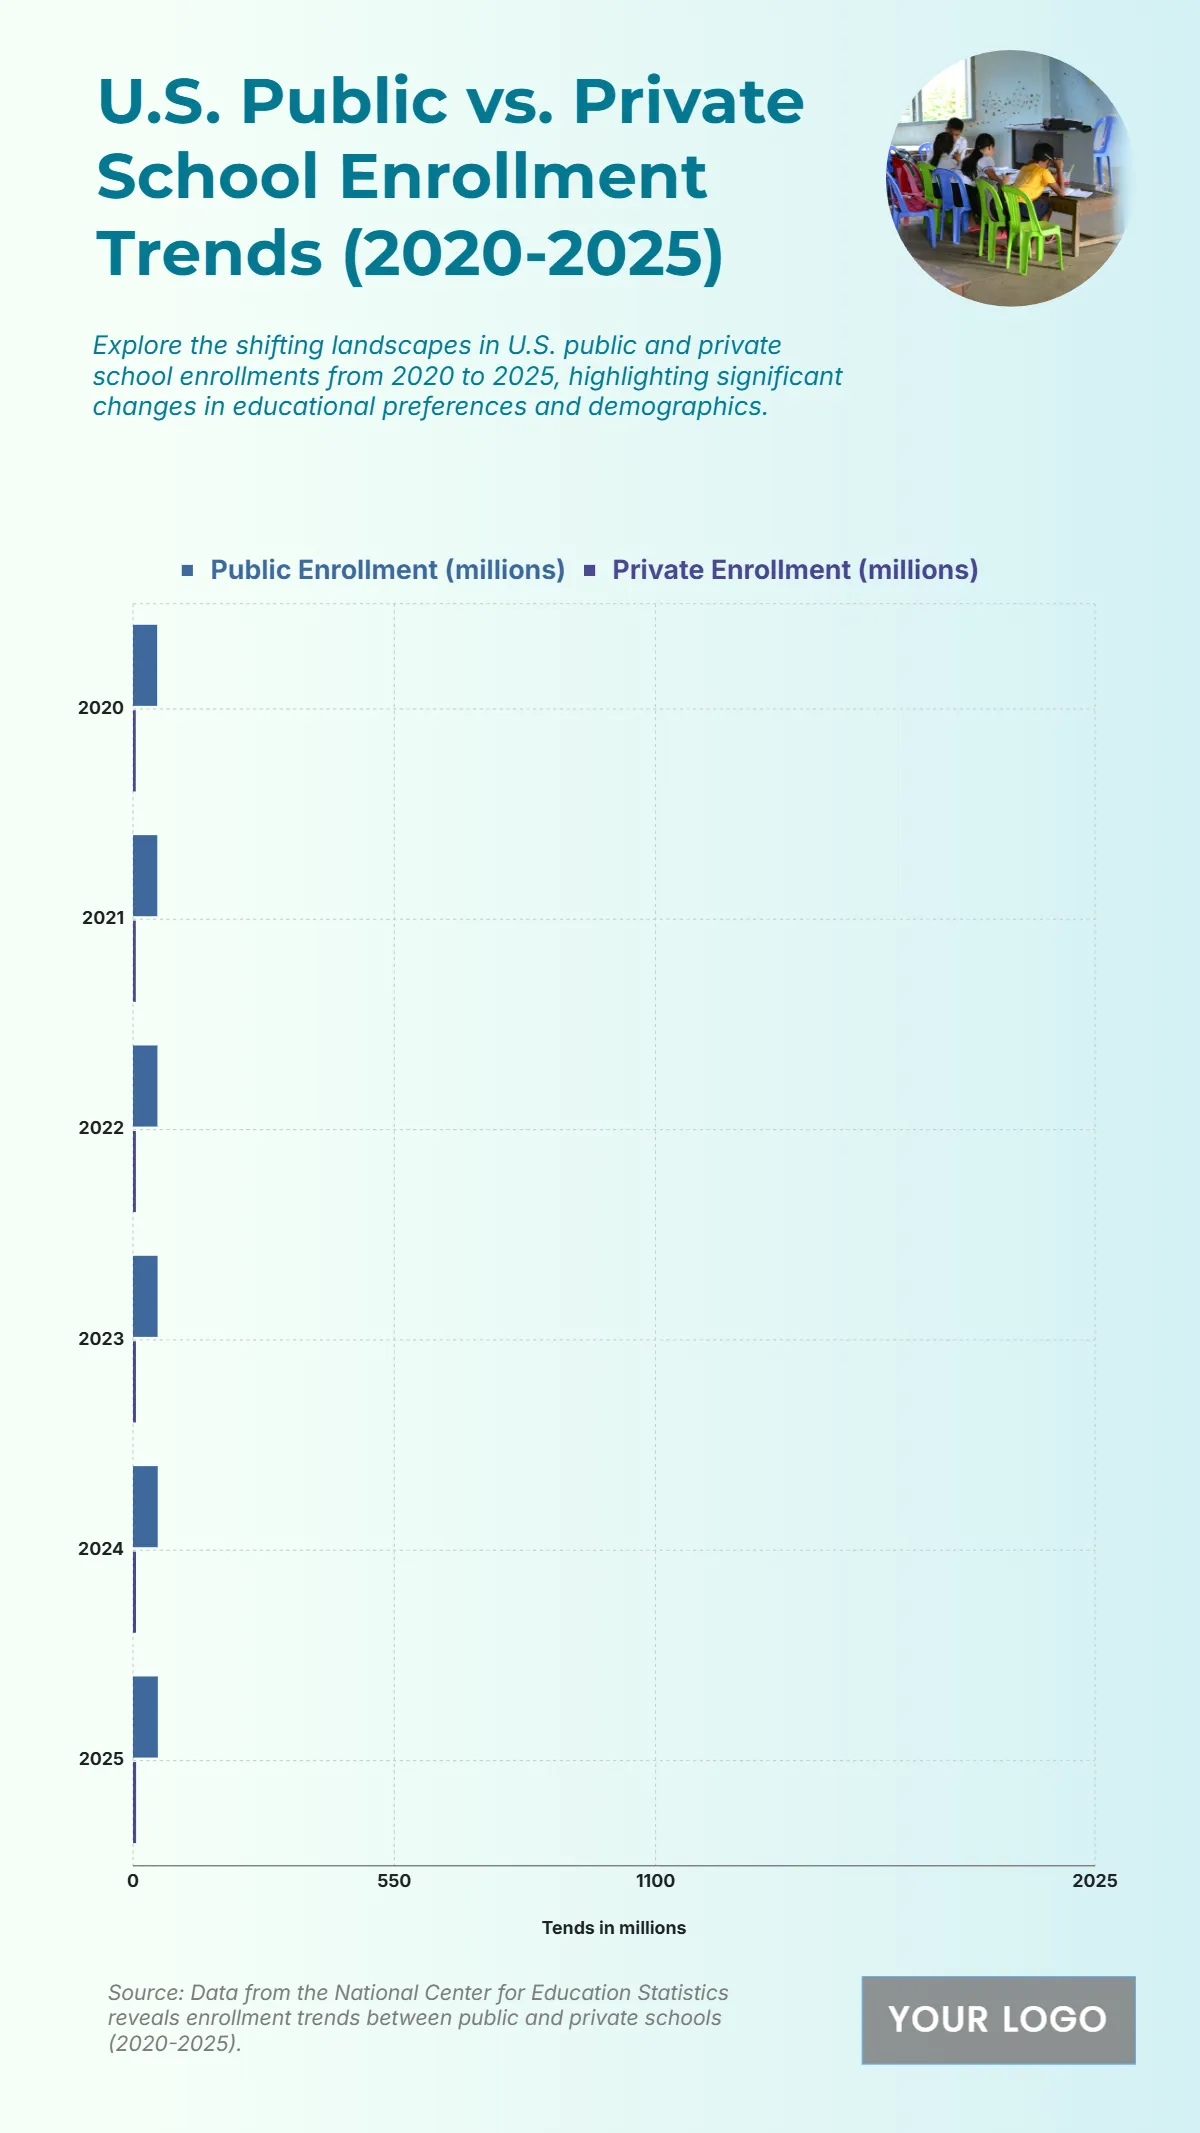
The chart illustrates the steady growth of both public and private school enrollment in the U.S. from 2020 to 2025, with public schools maintaining a significantly larger student population. Public enrollment begins at 50.8 million students in 2020 and gradually rises to 52.3 million by 2025, highlighting a consistent upward trend in public education participation. Meanwhile, private enrollment starts at 5.8 million students in 2020 and increases to 6.5 million by 2025, showing a more modest but noticeable growth. This indicates a balanced expansion in both sectors, with public schools remaining dominant while private education sees incremental gains likely due to changing educational preferences, accessibility, and demographic shifts.
| Labels | Public Enrollment (millions) | Private Enrollment (millions) |
|---|---|---|
| 2020 | 50.8 | 5.8 |
| 2021 | 51.1 | 5.9 |
| 2022 | 51.4 | 6.1 |
| 2023 | 51.7 | 6.2 |
| 2024 | 52.0 | 6.3 |
| 2025 | 52.3 | 6.5 |


