Free Top 20 U.S. States by Per Capita R&D Spending (2020-2025) Chart
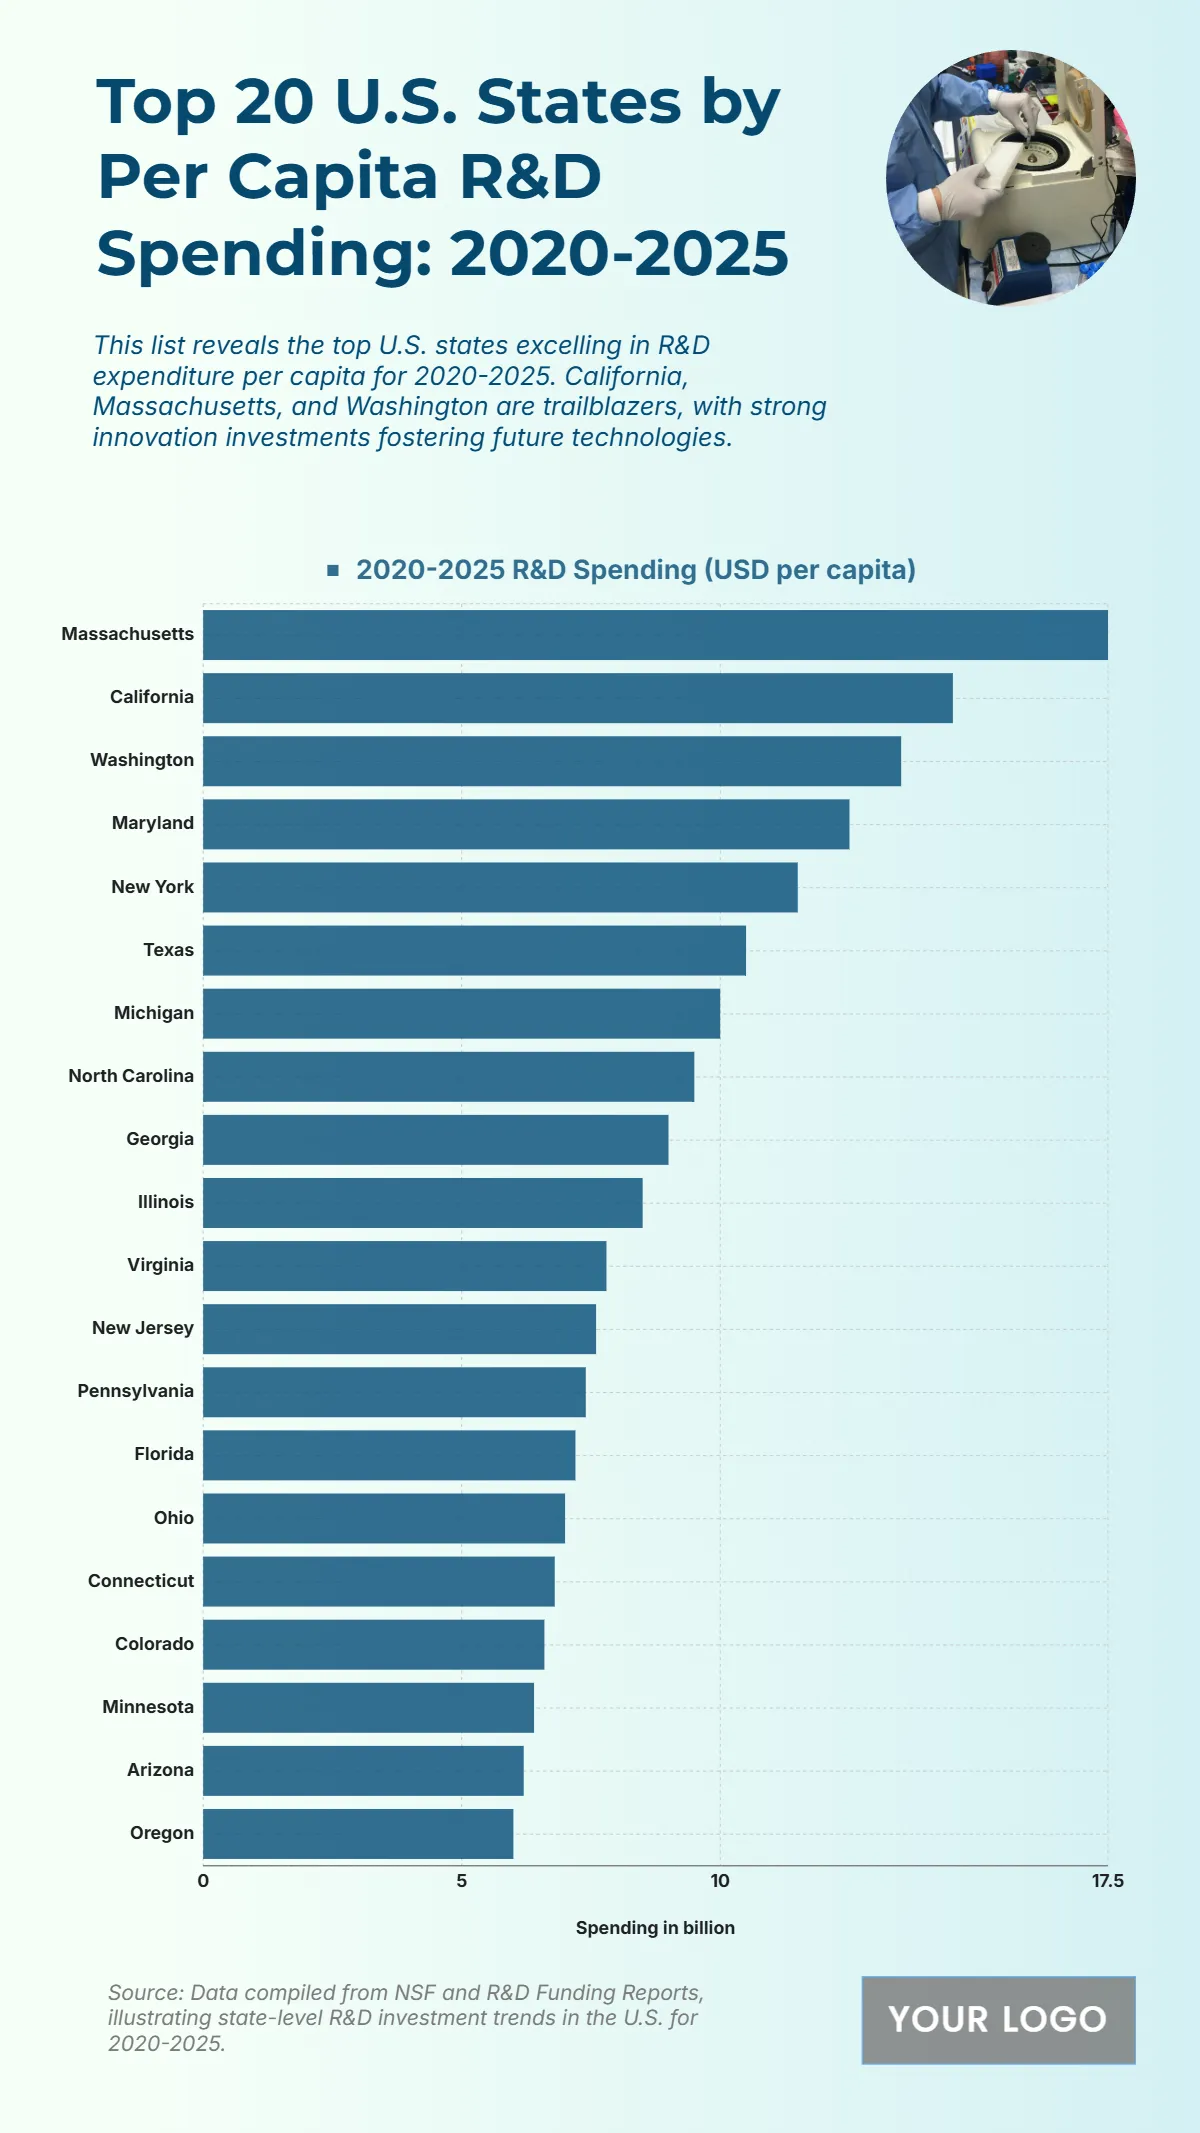
The chart highlights the states leading in per capita R&D spending between 2020 and 2025, emphasizing the dominance of innovation-driven economies. Massachusetts stands out with the highest spending at 17.5 USD per capita, reflecting its strong technology and research sectors. California follows with 14.5 USD, powered by its world-renowned innovation hubs. Washington records 13.5 USD, while Maryland and New York show 12.5 USD and 11.5 USD, respectively, emphasizing their contributions to research and development. Texas and Michigan both report 10.5 USD and 10 USD, followed by North Carolina at 9.5 USD and Georgia at 9 USD. Other notable states include Illinois at 8.5 USD, Virginia at 7.8 USD, and New Jersey at 7.6 USD. The broad distribution of R&D investment underscores the nationwide focus on advancing technology, science, and innovation capabilities.
| Labels | 2020–2025 R&D Spending (USD per capita) |
|---|---|
| Massachusetts | 17.5 |
| California | 14.5 |
| Washington | 13.5 |
| Maryland | 12.5 |
| New York | 11.5 |
| Texas | 10.5 |
| Michigan | 10 |
| North Carolina | 9.5 |
| Georgia | 9 |
| Illinois | 8.5 |
| Virginia | 7.8 |
| New Jersey | 7.6 |
| Pennsylvania | 7.4 |
| Florida | 7.2 |
| Ohio | 7 |
| Connecticut | 6.8 |
| Colorado | 6.6 |
| Minnesota | 6.4 |
| Arizona | 6.2 |
| Oregon | 6 |


