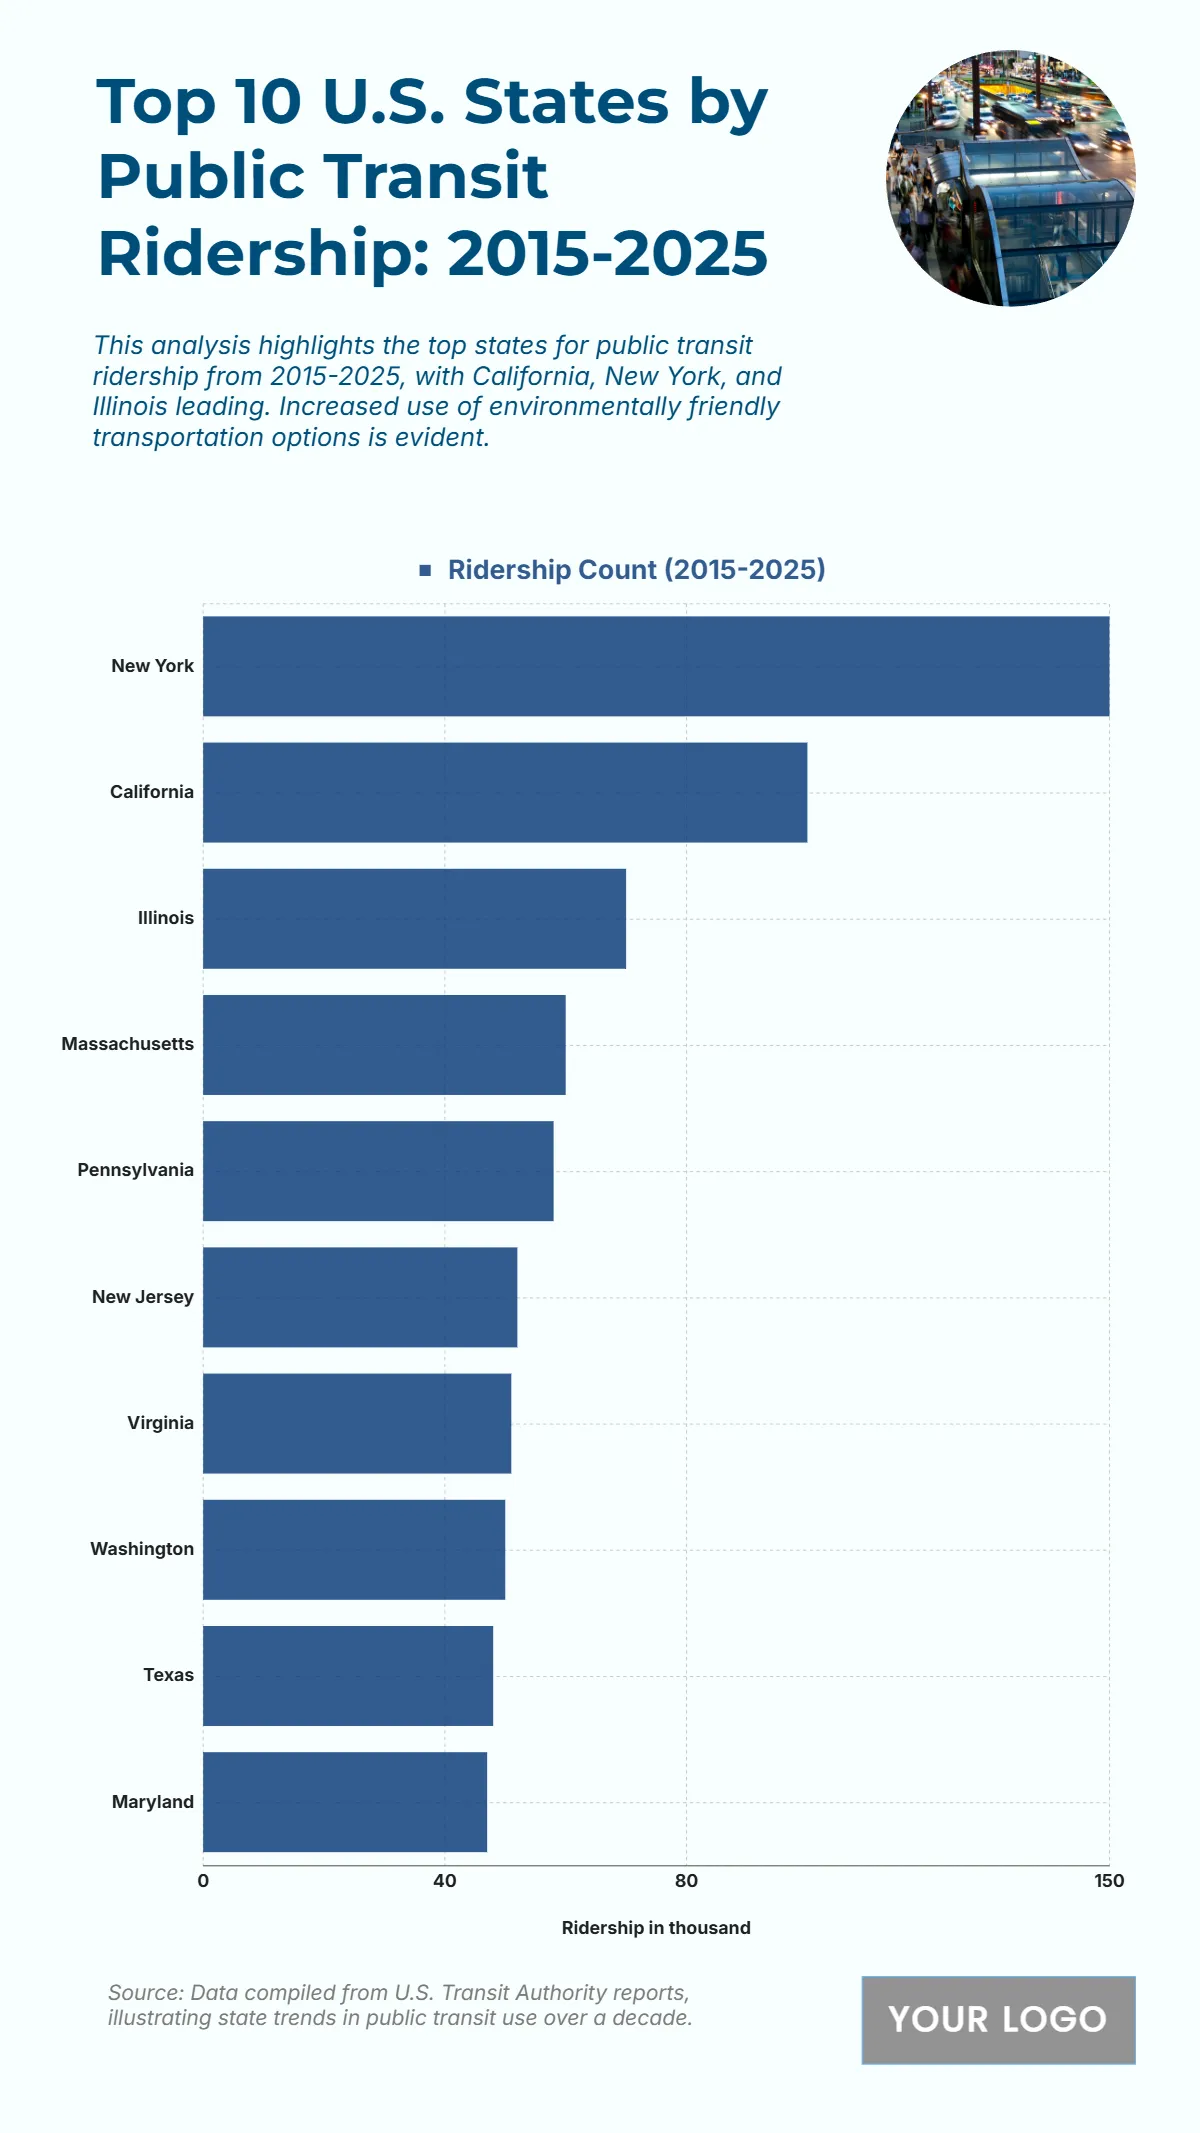
Free Top 10 U.S. States by Public Transit Ridership (2015-2025) Chart
The chart presents ridership trends from 2015 to 2025, showcasing which states lead in public transit usage. New York dominates with an impressive 150 thousand ridership count, reflecting its extensive subway, bus, and commuter rail systems. California follows at 100 thousand, driven by urban centers like Los Angeles and San Francisco. Illinois records 70 thousand, highlighting strong transit networks in cities like Chicago. Northeastern states such as Massachusetts with 60 thousand and Pennsylvania with 58 thousand demonstrate sustained commuter activity. New Jersey and Virginia post 52 thousand and 51 thousand, supported by their proximity to major metropolitan areas. Meanwhile, Washington, Texas, and Maryland round out the top ten with 50 thousand, 48 thousand, and 47 thousand, respectively. These figures indicate growing demand for efficient, sustainable transportation options across multiple regions.
| Labels | Ridership Count (2015–2025) |
|---|---|
| New York | 150 |
| California | 100 |
| Illinois | 70 |
| Massachusetts | 60 |
| Pennsylvania | 58 |
| New Jersey | 52 |
| Virginia | 51 |
| Washington | 50 |
| Texas | 48 |
| Maryland | 47 |


