Free Top 20 U.S. States by State-Level Credit Market Growth (2020-2025) Chart
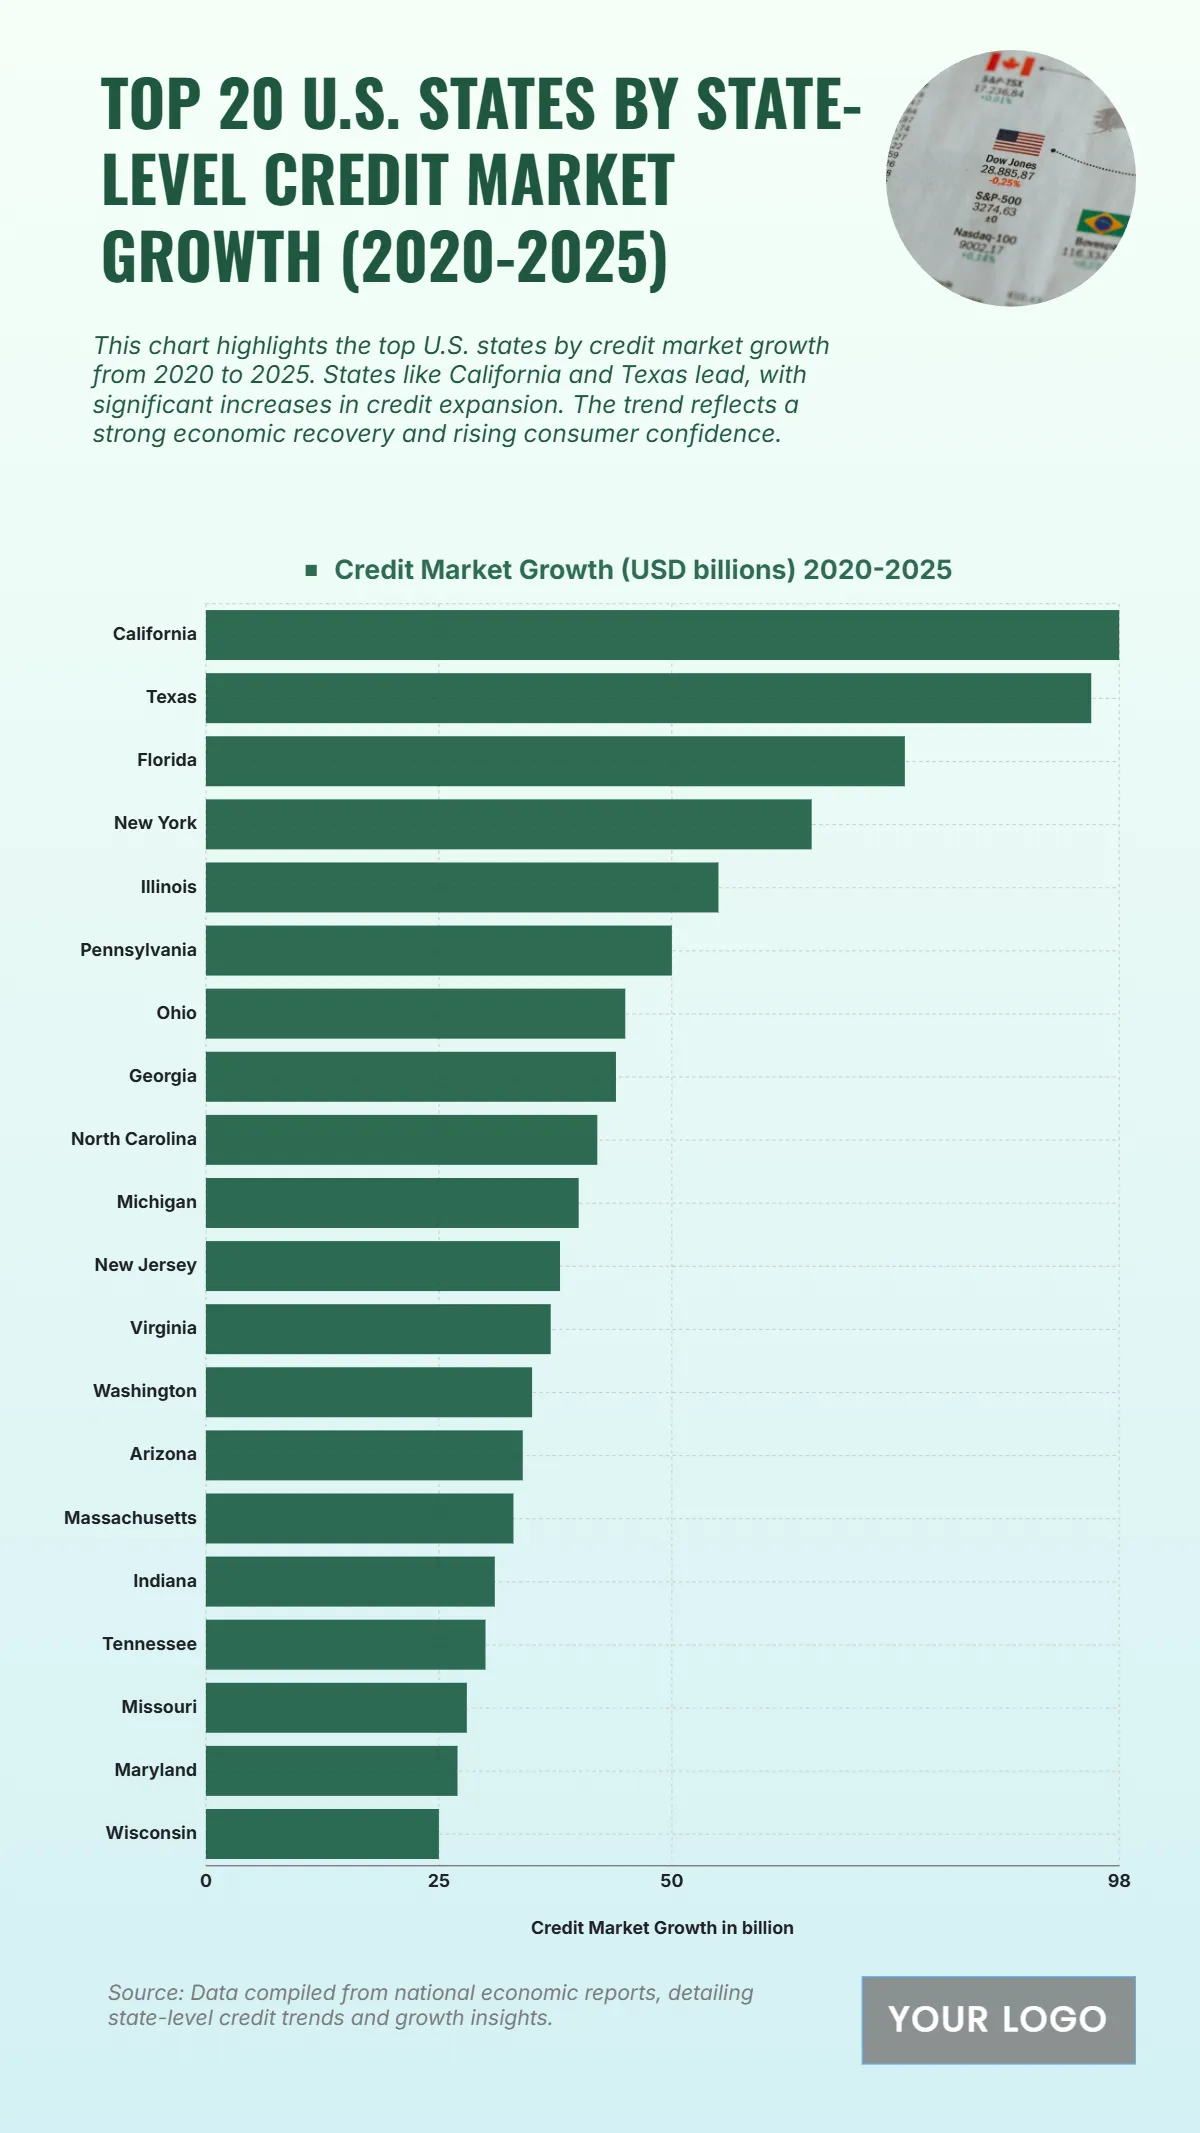
The chart reveals significant expansion in credit market activity from 2020 to 2025, showcasing strong consumer and business lending growth across leading U.S. states. California leads with a credit market growth of $98 billion, followed closely by Texas with $95 billion and Florida with $75 billion, reflecting their robust economies. New York reaches $65 billion, maintaining its position as a major financial hub. Midwestern and Northeastern states like Illinois and Pennsylvania report $55 billion and $50 billion, respectively, while Ohio stands at $45 billion and Georgia at $44 billion. Southern states such as North Carolina and Michigan also show notable growth, reaching $42 billion and $40 billion. Even smaller states like Maryland and Wisconsin, at $27 billion and $25 billion, indicate widespread credit expansion. This upward trend reflects strong economic recovery, rising consumer confidence, and increased lending across multiple regions.
| Labels | Credit Market Growth (USD billions) 2020–2025 |
|---|---|
| California | 98 |
| Texas | 95 |
| Florida | 75 |
| New York | 65 |
| Illinois | 55 |
| Pennsylvania | 50 |
| Ohio | 45 |
| Georgia | 44 |
| North Carolina | 42 |
| Michigan | 40 |
| New Jersey | 38 |
| Virginia | 37 |
| Washington | 35 |
| Arizona | 34 |
| Massachusetts | 33 |
| Indiana | 31 |
| Tennessee | 30 |
| Missouri | 28 |
| Maryland | 27 |
| Wisconsin | 25 |


