Free Top 10 U.S. States with the Highest Corporate Profits (2018-2025) Chart
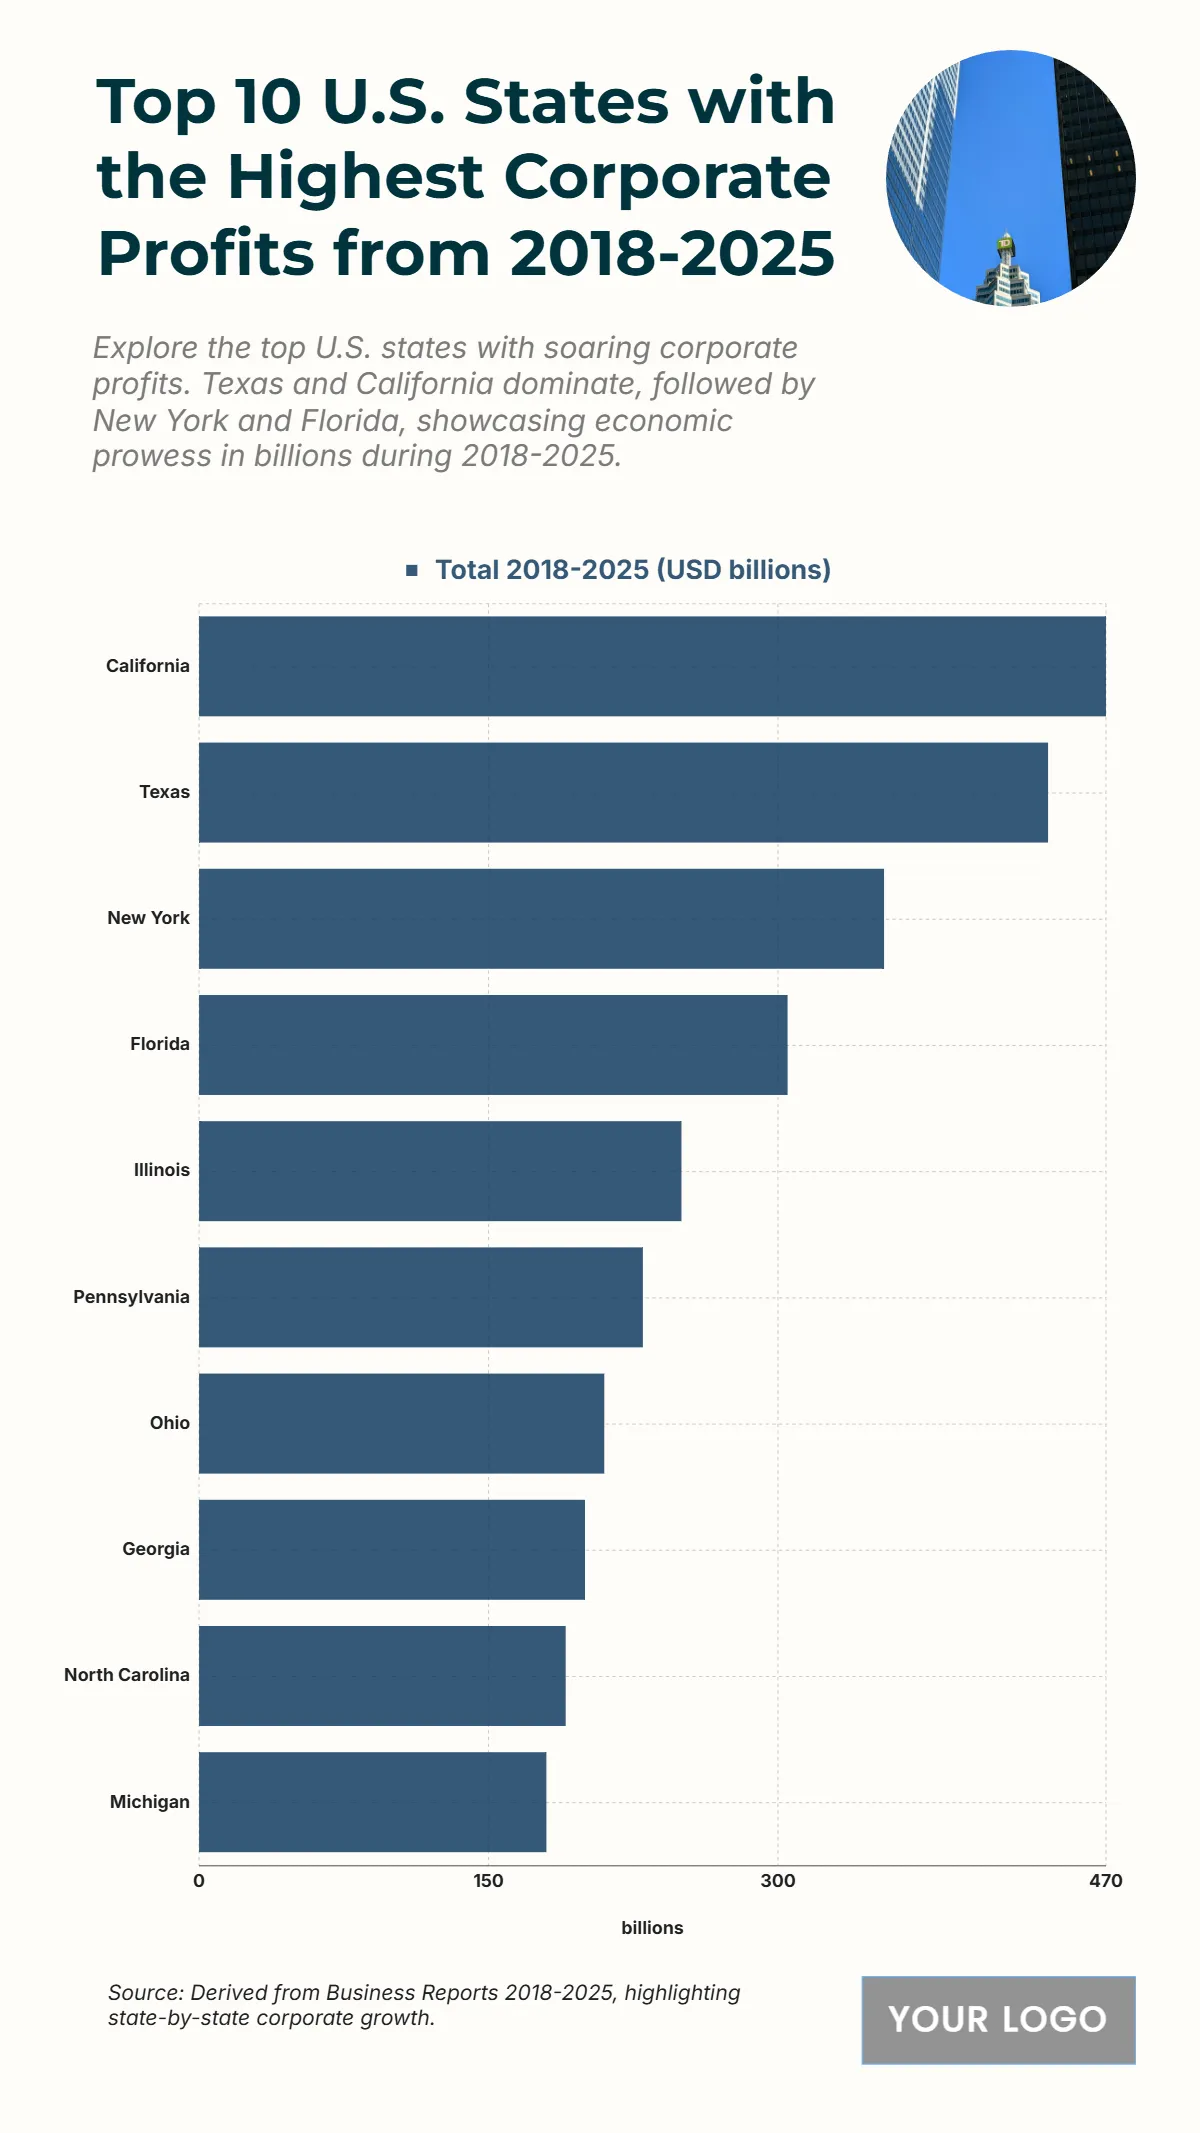
The chart highlights the top ten U.S. states generating the highest corporate profits between 2018 and 2025, showcasing the economic dominance of several major states. California leads with total corporate profits reaching USD 470 billion, reflecting its strong business ecosystem, particularly in technology and innovation sectors. Texas follows closely at USD 440 billion, driven by energy, technology, and manufacturing industries. New York ranks third with USD 355 billion, supported by finance and commerce. Florida reports USD 305 billion, while Illinois records USD 250 billion. Mid-range performers include Pennsylvania at USD 230 billion and Ohio at USD 210 billion. Meanwhile, Georgia and North Carolina contribute USD 200 billion and USD 190 billion respectively, with Michigan closing the top ten at USD 180 billion. These figures reflect the significant economic contributions of these states to national corporate profitability and highlight major centers of industrial and commercial activity.
| Labels | Total 2018–2025 (USD billions) |
|---|---|
| California | 470 |
| Texas | 440 |
| New York | 355 |
| Florida | 305 |
| Illinois | 250 |
| Pennsylvania | 230 |
| Ohio | 210 |
| Georgia | 200 |
| North Carolina | 190 |
| Michigan | 180 |


