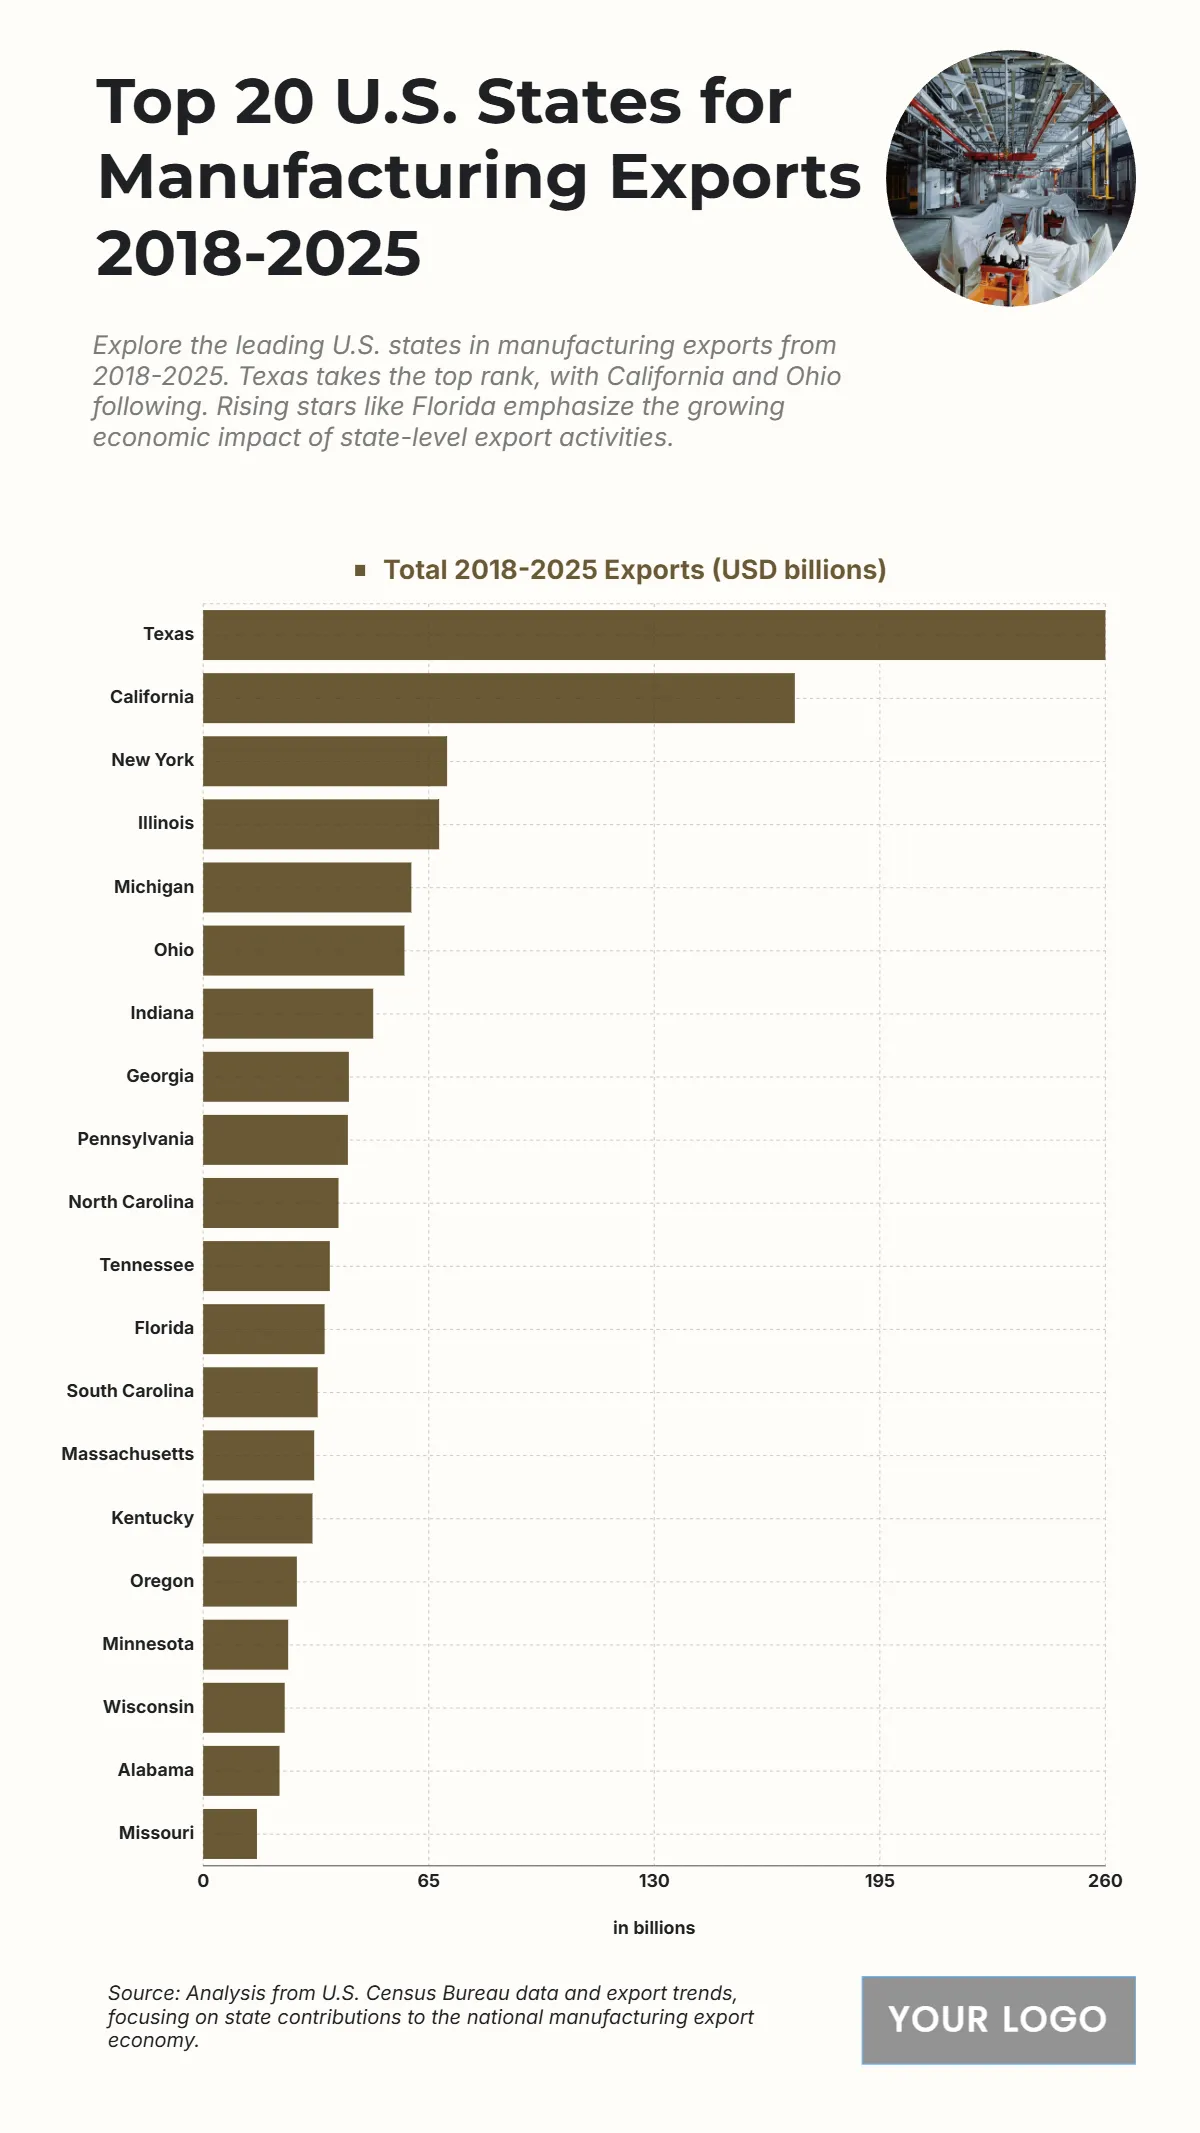
Free Top 20 U.S. States by Manufacturing Exports (2018-2025) Chart
The chart highlights manufacturing export values from 2018 to 2025 across twenty U.S. states, emphasizing the dominance of key industrial regions. Texas leads significantly with total manufacturing exports of USD 260 billion, reflecting its strong energy, technology, and industrial base. California follows with USD 170.5 billion, showcasing its advanced manufacturing and tech industries. New York ranks third at USD 70.3 billion, supported by pharmaceuticals, electronics, and machinery. Illinois contributes USD 68 billion, while Michigan records USD 60 billion, emphasizing its automotive sector strength. Ohio and Indiana follow closely with USD 58 billion and USD 49 billion respectively. Mid-range contributors include Georgia (USD 42B), Pennsylvania (USD 41.7B), and North Carolina (USD 39B). Lower-ranked but still significant states like Alabama, Wisconsin, and Missouri reflect a broad manufacturing footprint across the nation. Overall, these figures reveal how manufacturing exports remain a critical driver of U.S. economic performance.
| Labels | Total 2018–2025 Exports (USD billions) |
|---|---|
| Texas | 260 |
| California | 170.5 |
| New York | 70.3 |
| Illinois | 68 |
| Michigan | 60 |
| Ohio | 58 |
| Indiana | 49 |
| Georgia | 42 |
| Pennsylvania | 41.7 |
| North Carolina | 39 |
| Tennessee | 36.5 |
| Florida | 35 |
| South Carolina | 33 |
| Massachusetts | 32 |
| Kentucky | 31.5 |
| Oregon | 27 |
| Minnesota | 24.5 |
| Wisconsin | 23.5 |
| Alabama | 22 |
| Missouri | 15.5 |


