Free Top 10 U.S. States with the Largest Workforce in Tech (2020-2025) Chart
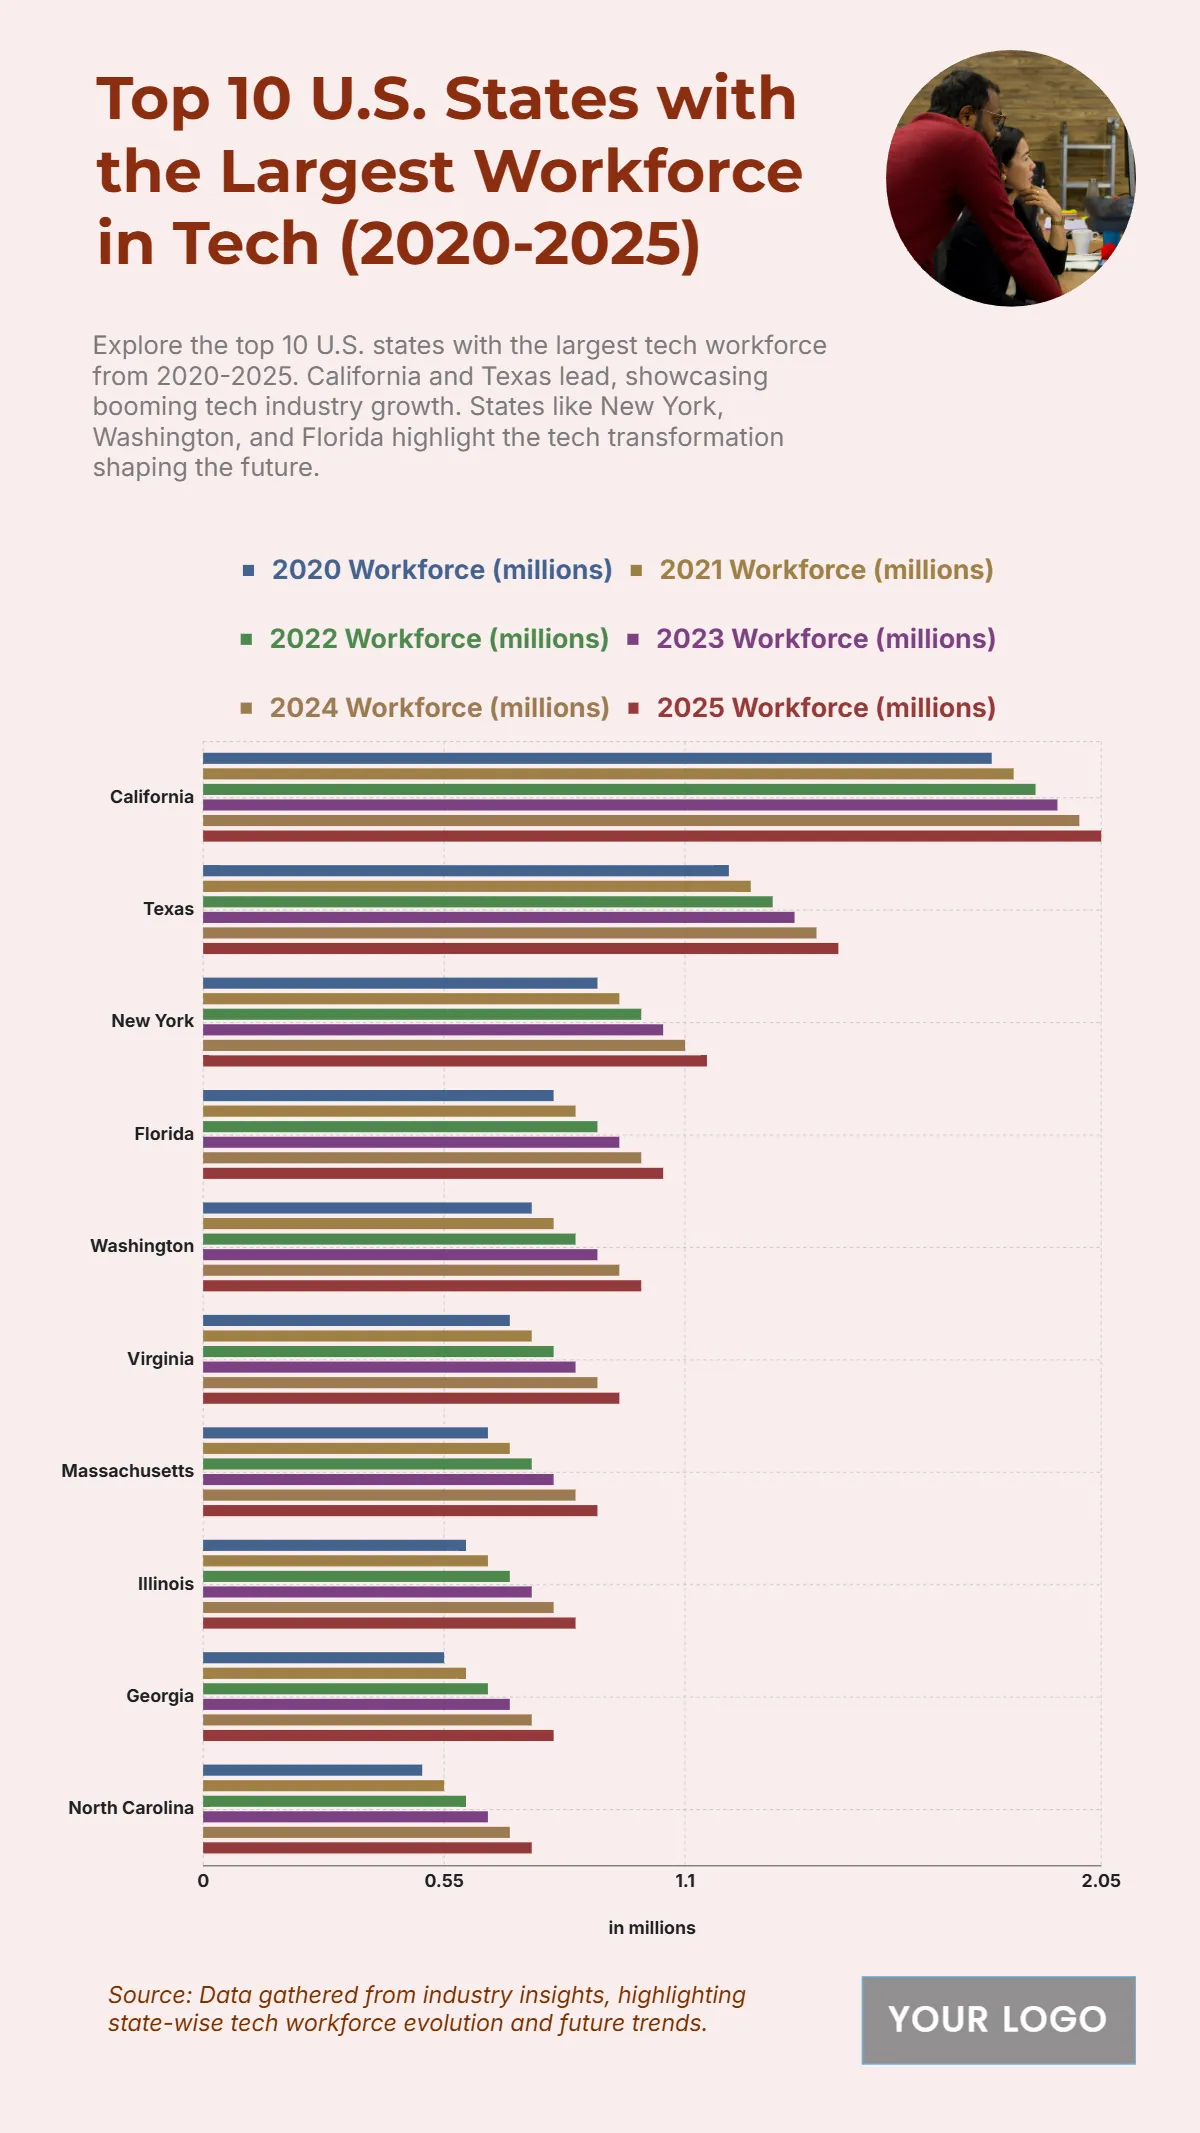
The chart illustrates the steady growth of the tech workforce across the top 10 U.S. states from 2020 to 2025, emphasizing rapid expansion in major innovation hubs. California leads by a wide margin, increasing from 1,500,000 workers in 2020 to a projected 1,750,000 by 2025, highlighting its dominance in software, AI, and digital industries. Texas follows strongly, growing from 850,000 to 1,100,000 in the same period, reflecting its emerging role as a tech hub. New York shows consistent gains from 700,000 to 800,000, while Florida jumps from 450,000 to 600,000, driven by startup and IT sector growth. States such as Washington, Virginia, and Illinois also experience steady increases, each surpassing 460,000–500,000 workers by 2025. Meanwhile, Massachusetts, Georgia, and North Carolina demonstrate solid momentum, each reaching 430,000–450,000 workers. Overall, the data reveals a strong nationwide trend of accelerating tech employment, led by California and Texas as key innovation drivers.
| Labels | 2020 | 2021 | 2022 | 2023 | 2024 | 2025 |
|---|---|---|---|---|---|---|
| California | 1500 | 1550 | 1600 | 1650 | 1700 | 1750 |
| Texas | 850 | 900 | 950 | 1000 | 1050 | 1100 |
| New York | 700 | 720 | 740 | 760 | 780 | 800 |
| Florida | 450 | 480 | 510 | 540 | 570 | 600 |
| Virginia | 400 | 420 | 440 | 460 | 480 | 500 |
| Illinois | 380 | 400 | 420 | 440 | 460 | 480 |
| Washington | 360 | 380 | 400 | 420 | 440 | 460 |
| Massachusetts | 350 | 370 | 390 | 410 | 430 | 450 |
| Georgia | 340 | 360 | 380 | 400 | 420 | 440 |
| North Carolina | 330 | 350 | 370 | 390 | 410 | 430 |


