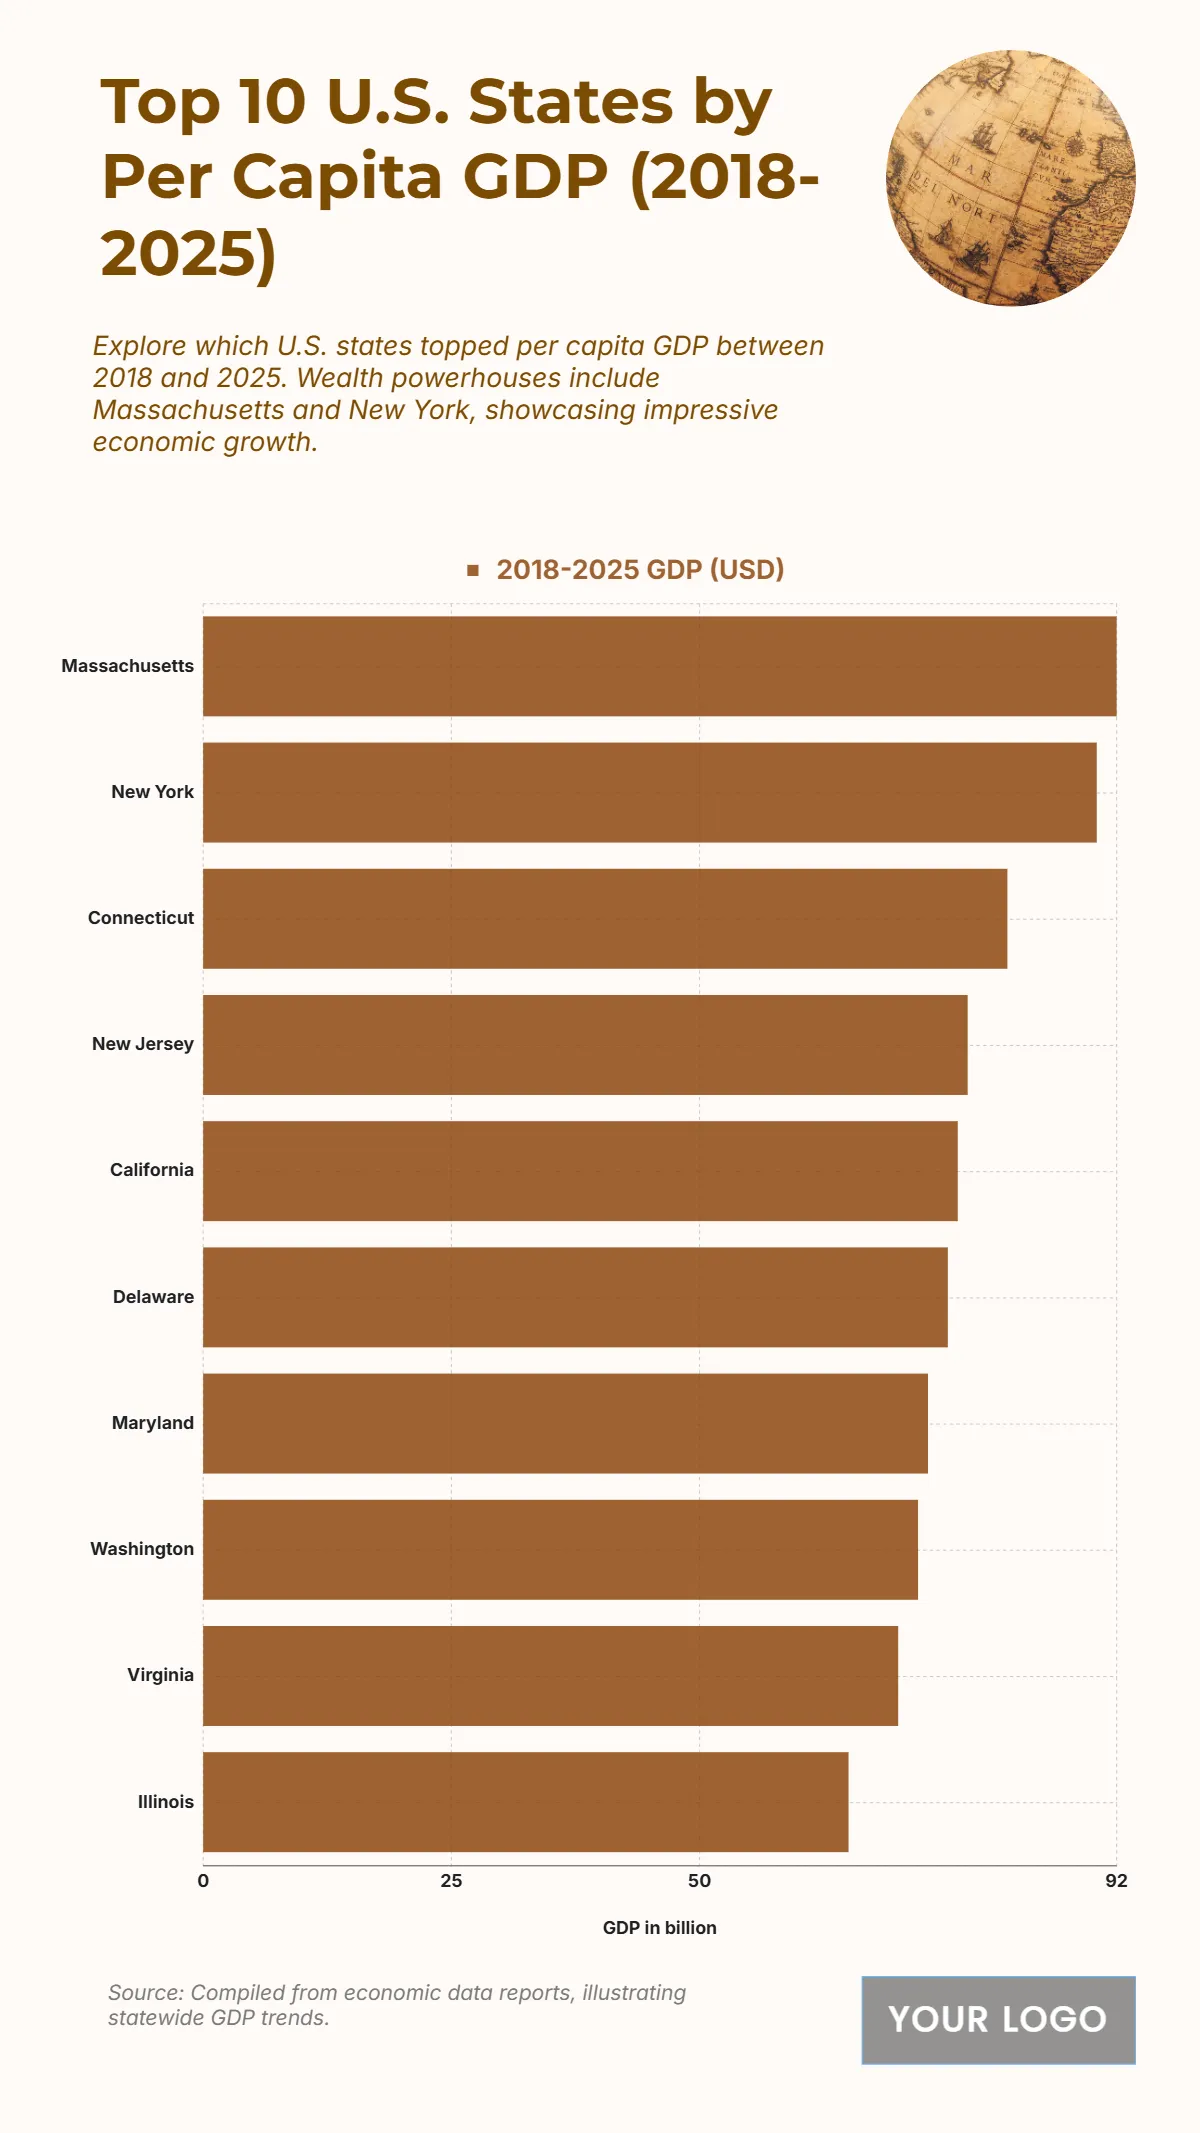
Free Top 10 U.S. States by Per Capita GDP (2018-2025) Chart
The chart reveals the states with the highest per capita GDP between 2018 and 2025, underscoring strong economic performance and regional wealth concentration. Massachusetts leads the ranking with a per capita GDP of USD 92 billion, followed closely by New York at USD 90 billion, reflecting their robust financial, technological, and educational sectors. Connecticut comes next with USD 81 billion, supported by its thriving insurance and finance industries. New Jersey records USD 77 billion, while California reaches USD 76 billion, demonstrating its continued dominance in technology and commerce. States like Delaware (USD 75 billion), Maryland (USD 73 billion), and Washington (USD 72 billion) also show impressive performance, driven by innovation and high-value industries. Virginia follows with USD 70 billion, and Illinois rounds out the top ten at USD 65 billion. These figures reflect diverse economic strengths and regional GDP concentration in key U.S. states.
| Labels | 2018–2025 GDP (USD billions) |
|---|---|
| Massachusetts | 92 |
| New York | 90 |
| Connecticut | 81 |
| New Jersey | 77 |
| California | 76 |
| Delaware | 75 |
| Maryland | 73 |
| Washington | 72 |
| Virginia | 70 |
| Illinois | 65 |


