Free Top 10 U.S. States by Change in Labor Force Participation Rate (2020-2025) Chart
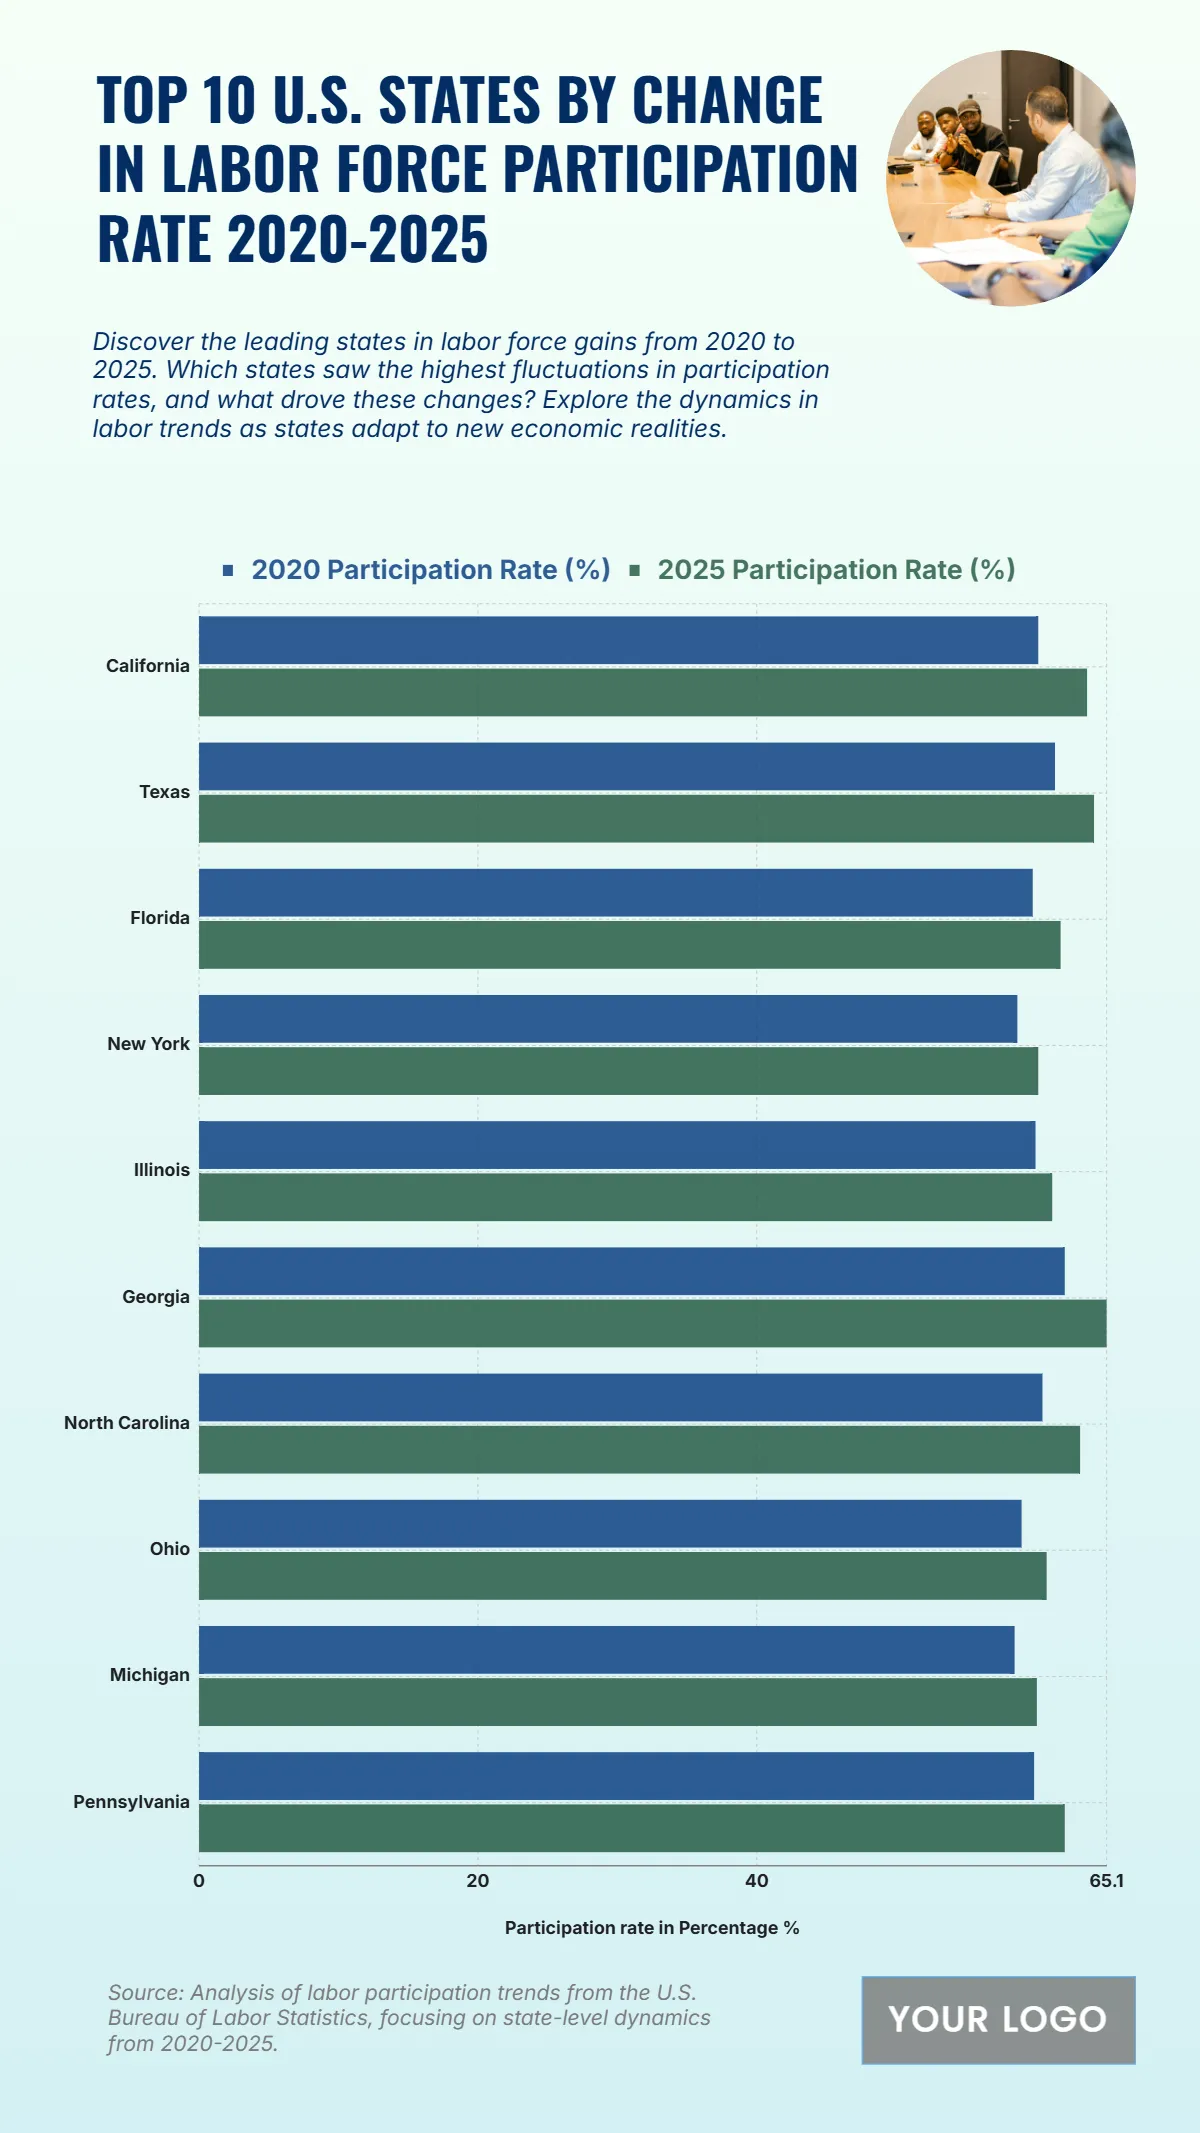
The chart highlights the notable shifts in labor force participation rates from 2020 to 2025, indicating an overall upward trend across major U.S. states. Texas records the highest increase, rising from 61.4% in 2020 to 64.2% in 2025, reflecting strong labor market recovery and workforce engagement. Georgia follows with a significant jump from 62.1% to 65.1%, while California moves from 60.2% to 63.7%, underscoring solid job market expansion. North Carolina also exhibits growth, climbing from 60.5% to 63.2%, supported by employment gains in key industries. Florida improves from 59.8% to 61.8%, and New York rises from 58.7% to 60.2%, indicating moderate recovery. Illinois reaches 61.2%, Ohio grows to 60.8%, Michigan to 60.1%, and Pennsylvania to 62.1% by 2025. These increases reflect widening economic participation and positive workforce trends across several states during the five-year period.
| Labels | 2020 Participation Rate (%) | 2025 Participation Rate (%) |
|---|---|---|
| California | 60.2 | 63.7 |
| Texas | 61.4 | 64.2 |
| Florida | 59.8 | 61.8 |
| New York | 58.7 | 60.2 |
| Illinois | 60.0 | 61.2 |
| Georgia | 62.1 | 65.1 |
| North Carolina | 60.5 | 63.2 |
| Ohio | 59.0 | 60.8 |
| Michigan | 58.5 | 60.1 |
| Pennsylvania | 59.9 | 62.1 |


