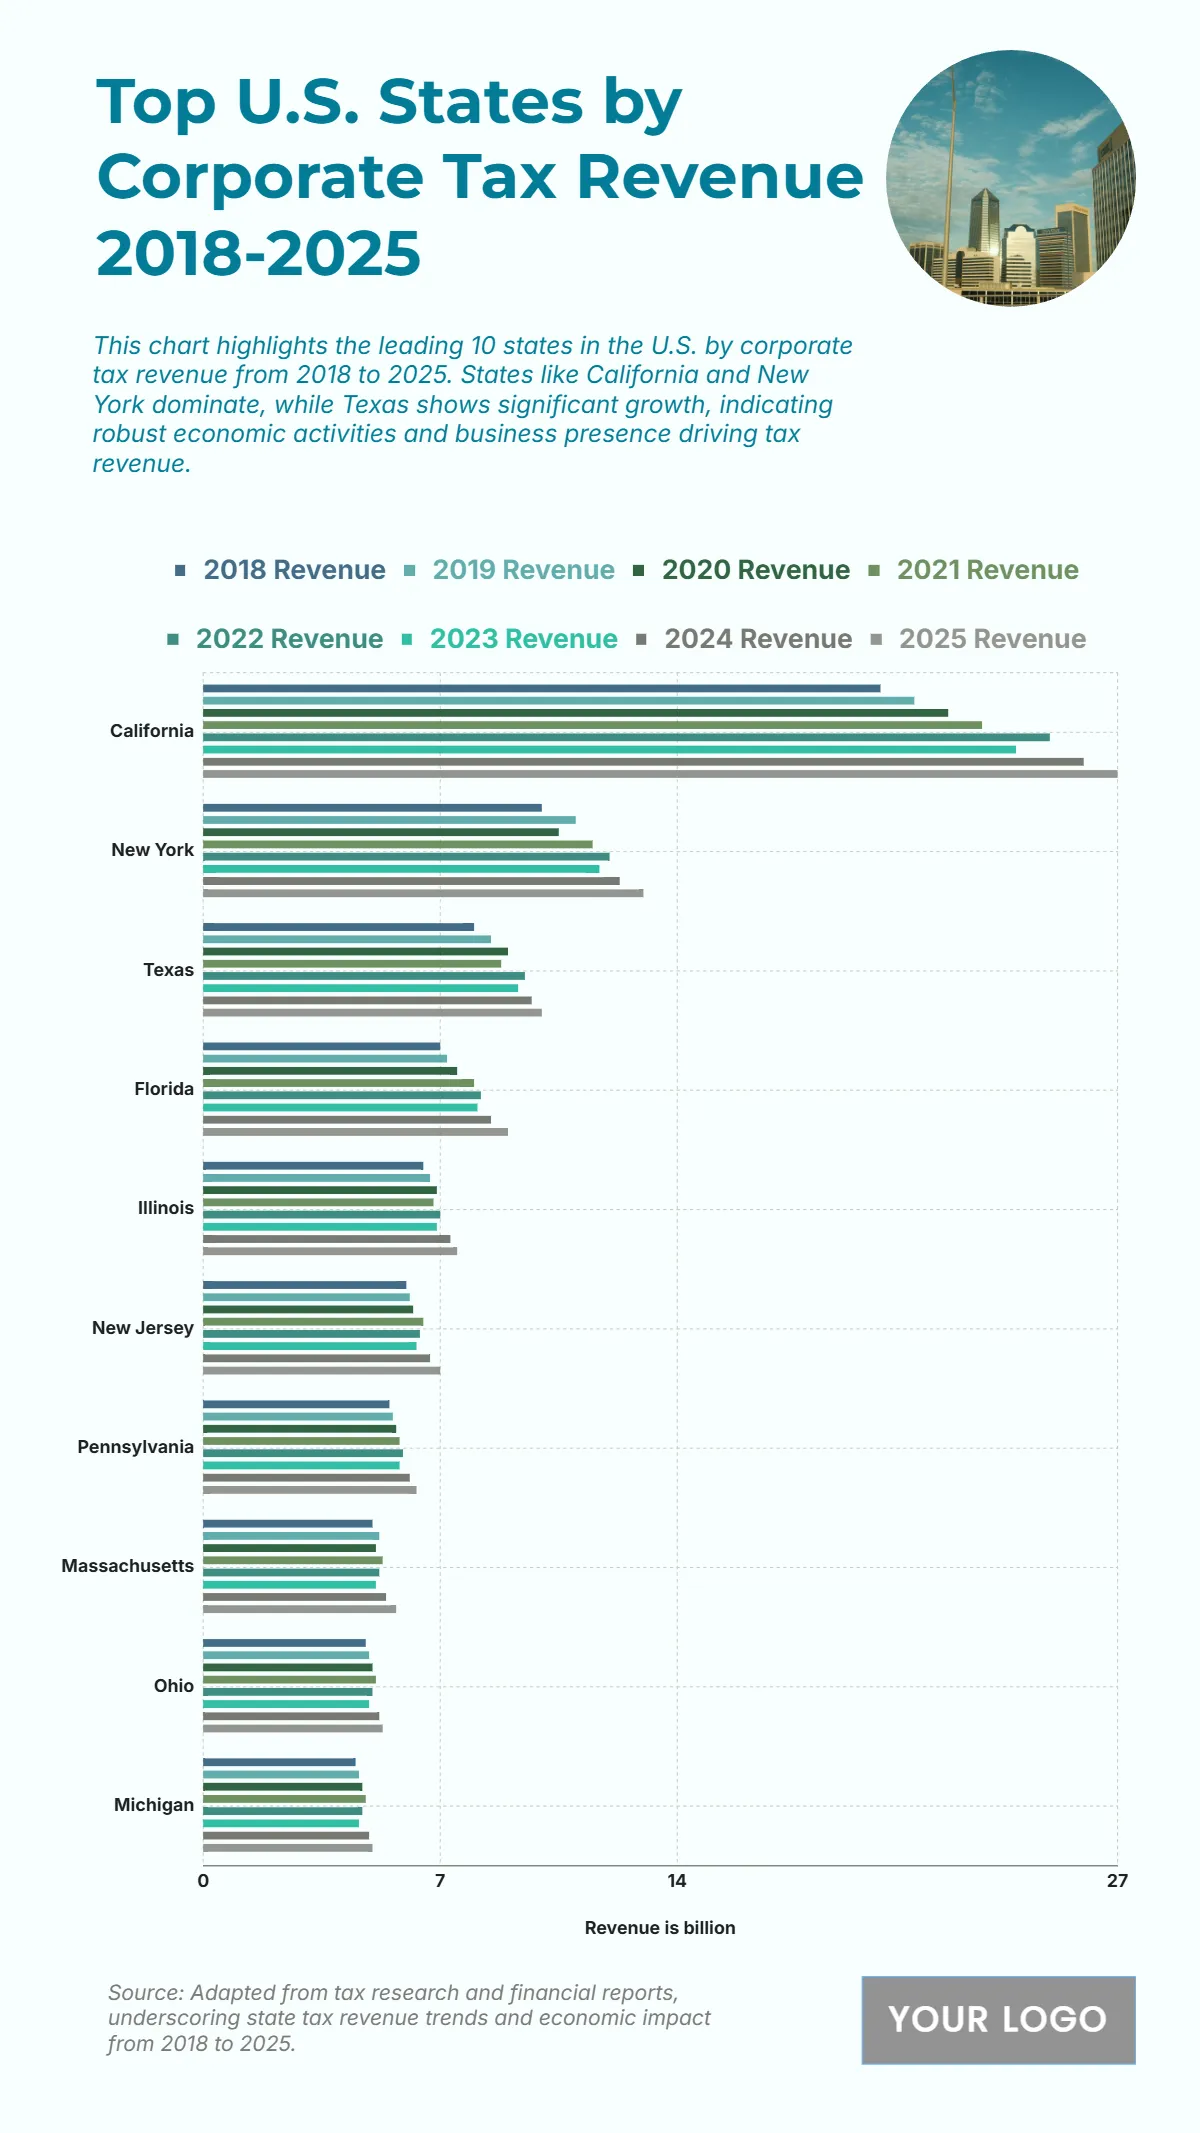
Free Top 10 U.S. States by Total Corporate Tax Revenue (2018-2025) Chart
The chart presents the upward trajectory of corporate tax revenue from 2018 to 2025 across the top ten U.S. states, showcasing sustained business expansion and fiscal growth. California dominates with revenue rising from USD 20 billion in 2018 to USD 27 billion in 2025, reflecting its strong corporate ecosystem. New York follows, increasing from USD 10 billion to USD 13 billion, underscoring its solid economic base. Texas climbs from USD 8 billion to USD 10 billion, showing steady growth. Florida moves from USD 7 billion to USD 9 billion, while Illinois grows from USD 6.5 billion to USD 7.5 billion, highlighting diversified economic activities. New Jersey expands from USD 6 billion to USD 7 billion, and Pennsylvania from USD 5.5 billion to USD 6.3 billion. Moderate but consistent increases are also seen in Massachusetts (USD 5 to 5.7 billion), Ohio (USD 4.8 to 5.3 billion), and Michigan (USD 4.5 to 5 billion), reflecting broad-based economic resilience.
| Labels | 2018 Revenue | 2019 Revenue | 2020 Revenue | 2021 Revenue | 2022 Revenue | 2023 Revenue | 2024 Revenue | 2025 Revenue |
|---|---|---|---|---|---|---|---|---|
| California | 20 | 21 | 22 | 23 | 25 | 24 | 26 | 27 |
| New York | 10 | 11 | 10.5 | 11.5 | 12 | 11.7 | 12.3 | 13 |
| Texas | 8 | 8.5 | 9 | 8.8 | 9.5 | 9.3 | 9.7 | 10 |
| Florida | 7 | 7.2 | 7.5 | 8 | 8.2 | 8.1 | 8.5 | 9 |
| Illinois | 6.5 | 6.7 | 6.9 | 6.8 | 7 | 6.9 | 7.3 | 7.5 |
| New Jersey | 6 | 6.1 | 6.2 | 6.5 | 6.4 | 6.3 | 6.7 | 7 |
| Pennsylvania | 5.5 | 5.6 | 5.7 | 5.8 | 5.9 | 5.8 | 6.1 | 6.3 |
| Massachusetts | 5 | 5.2 | 5.1 | 5.3 | 5.2 | 5.1 | 5.4 | 5.7 |
| Ohio | 4.8 | 4.9 | 5 | 5.1 | 5 | 4.9 | 5.2 | 5.3 |
| Michigan | 4.5 | 4.6 | 4.7 | 4.8 | 4.7 | 4.6 | 4.9 | 5 |


