Free Top 5 U.S. States by Tourism Revenue per Capita (2015-2025) Chart
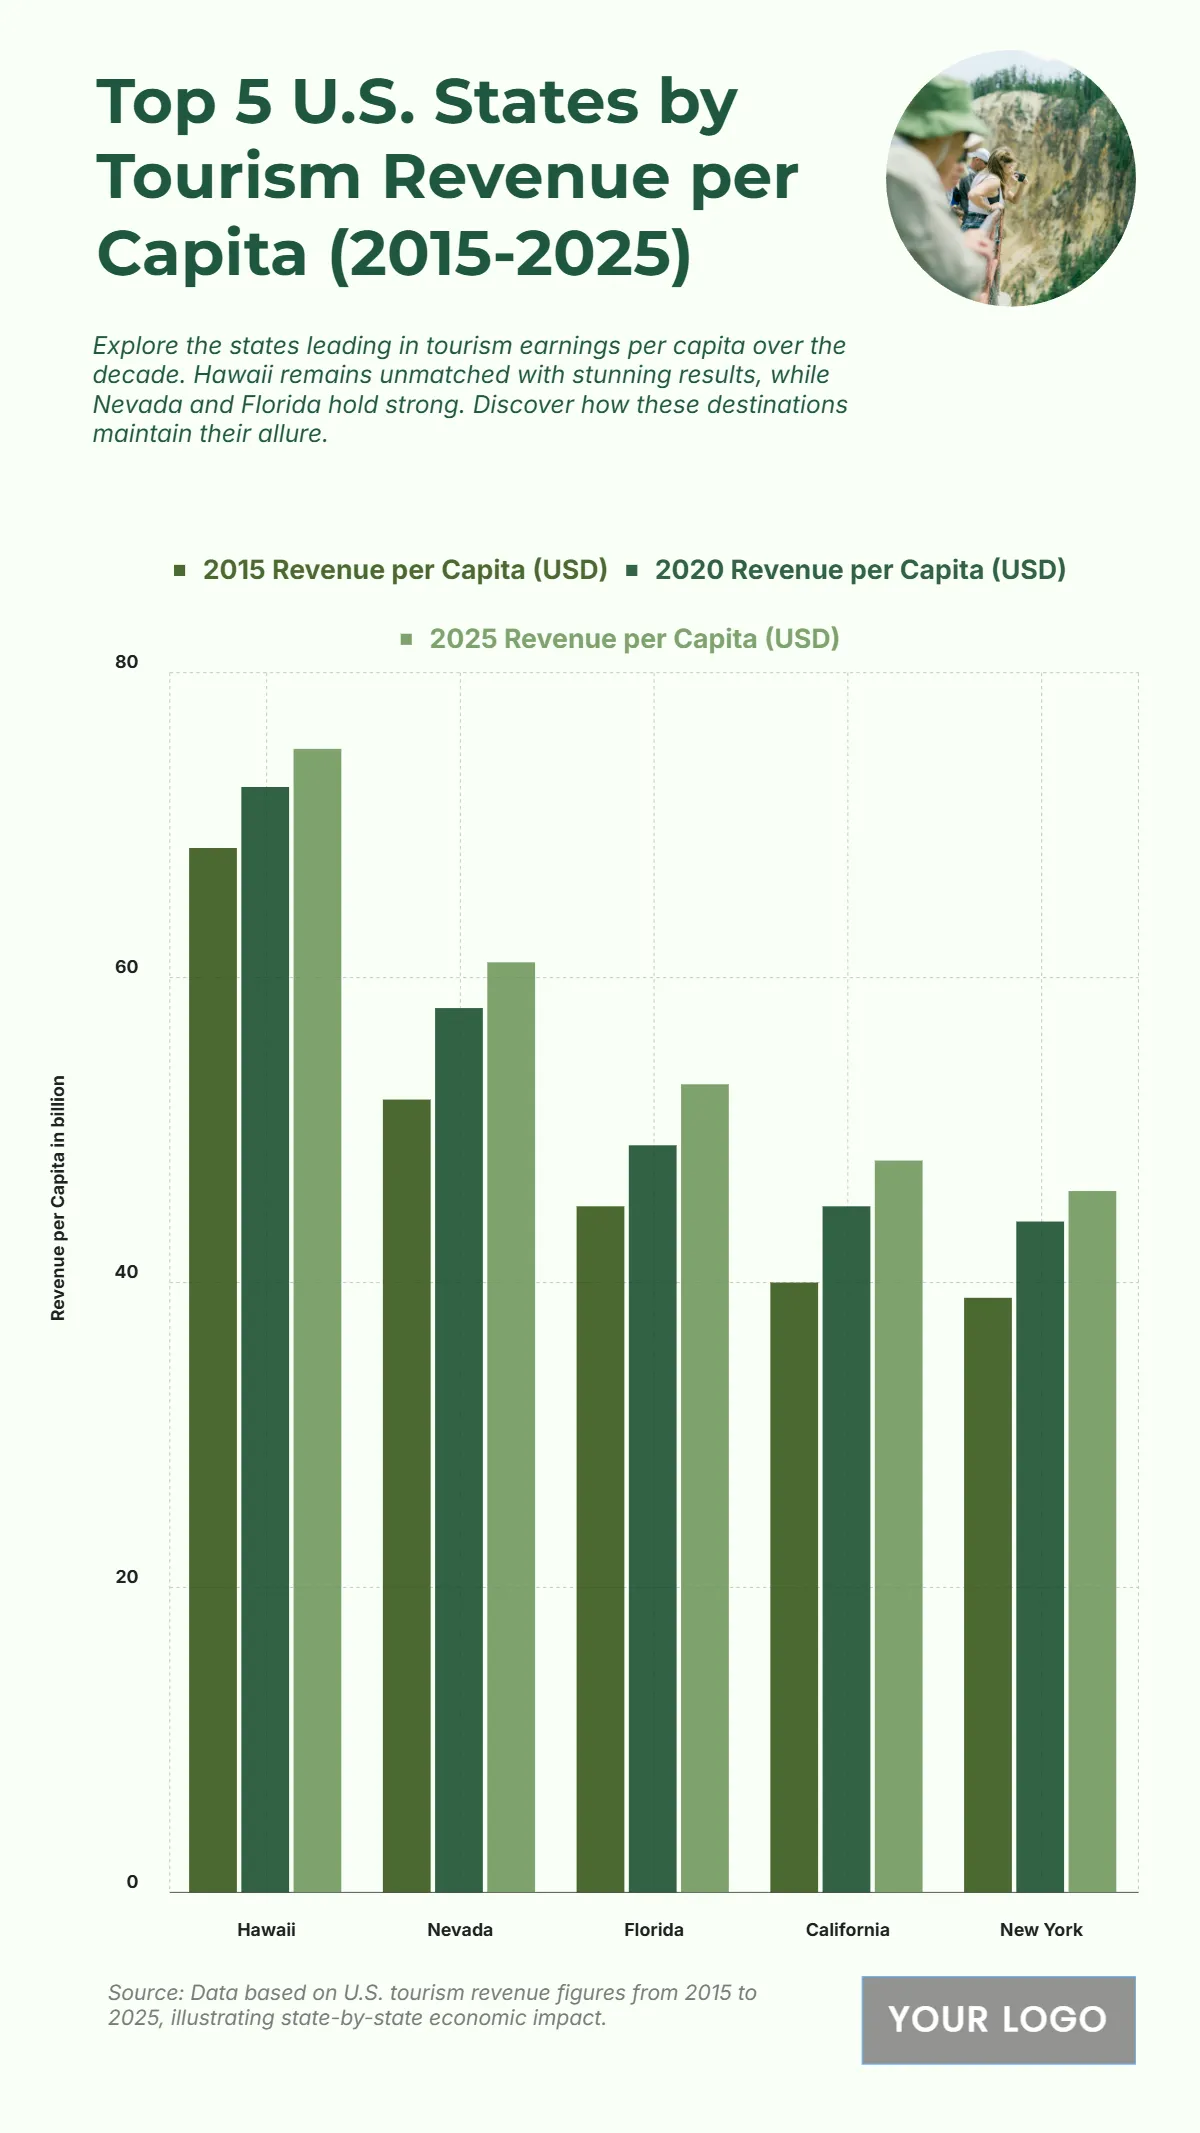
The chart showcases the consistent rise in tourism revenue per capita from 2015 to 2025 across the top five U.S. states, emphasizing the strong performance of leading destinations. Hawaii dominates with figures growing from USD 68.5 in 2015 to USD 72.5 in 2020 and reaching USD 75 by 2025, reflecting its unmatched appeal as a premier tourist hub. Nevada follows with an increase from USD 52 to USD 61, driven by its entertainment and hospitality industries. Florida shows solid growth from USD 45 to USD 53, highlighting its sustained popularity among both domestic and international travelers. California rises from USD 40 to USD 48, benefiting from diverse attractions and strong tourism infrastructure. New York climbs from USD 39 to USD 46, showcasing its enduring appeal as a global cultural and business destination. Overall, the upward trend underscores the resilience and continued expansion of the tourism sector over the decade.
| Labels | 2015 Revenue per Capita (USD) | 2020 Revenue per Capita (USD) | 2025 Revenue per Capita (USD) |
|---|---|---|---|
| Hawaii | 68.5 | 72.5 | 75 |
| Nevada | 52 | 58 | 61 |
| Florida | 45 | 49 | 53 |
| California | 40 | 45 | 48 |
| New York | 39 | 44 | 46 |


