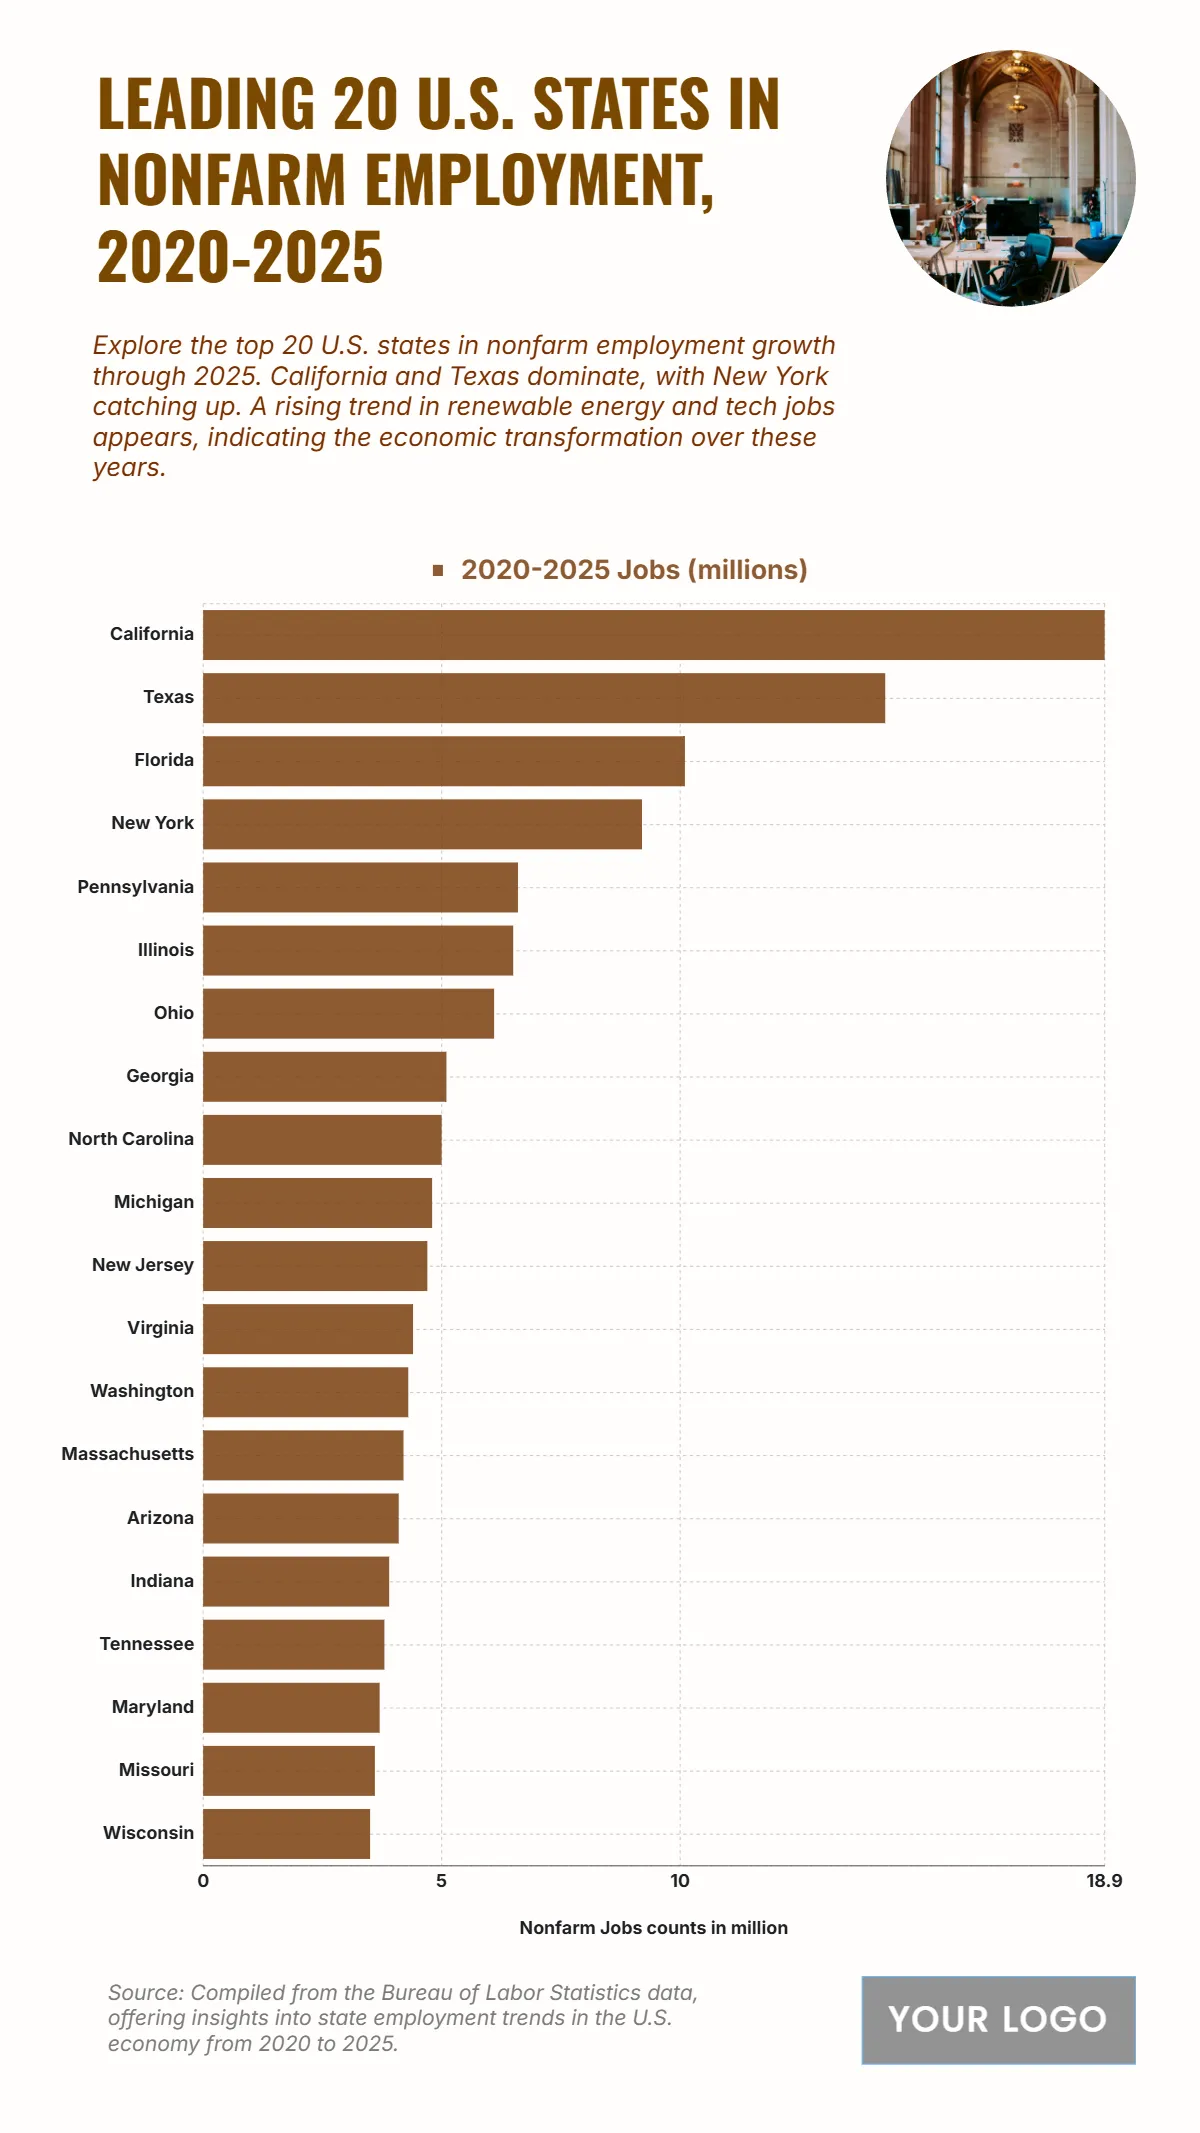
Free Top 20 U.S. States by Nonfarm Employment (2020-2025) Chart
The chart reveals the dominance of major U.S. states in nonfarm employment between 2020 and 2025, underscoring strong economic activity and labor force expansion. California leads with 18.9 million jobs, reflecting its broad economic base and diversified industries. Texas follows at 14.3 million, fueled by its rapid population growth and thriving business environment. Florida records 10.1 million, highlighting its expanding service and tourism-driven economy. New York reaches 9.2 million, emphasizing its enduring role as a national economic hub. Pennsylvania and Illinois show employment levels of 6.6 million and 6.5 million, respectively, illustrating their steady labor market performance. Ohio at 6.1 million and Georgia at 5.1 million maintain strong positions. Other states including North Carolina (5 million), Michigan (4.8 million), and New Jersey (4.7 million) demonstrate solid job markets, while states like Wisconsin close the top 20 with 3.5 million jobs. This trend reflects a geographically diverse employment landscape driving U.S. economic momentum.
| Labels | 2020–2025 Jobs (millions) |
|---|---|
| California | 18.9 |
| Texas | 14.3 |
| Florida | 10.1 |
| New York | 9.2 |
| Pennsylvania | 6.6 |
| Illinois | 6.5 |
| Ohio | 6.1 |
| Georgia | 5.1 |
| North Carolina | 5 |
| Michigan | 4.8 |
| New Jersey | 4.7 |
| Virginia | 4.4 |
| Washington | 4.3 |
| Massachusetts | 4.2 |
| Arizona | 4.1 |
| Indiana | 3.9 |
| Tennessee | 3.8 |
| Maryland | 3.7 |
| Missouri | 3.6 |
| Wisconsin | 3.5 |


