Free U.S. Top 20 States by Per Capita Income Growth (2020-2025) Chart
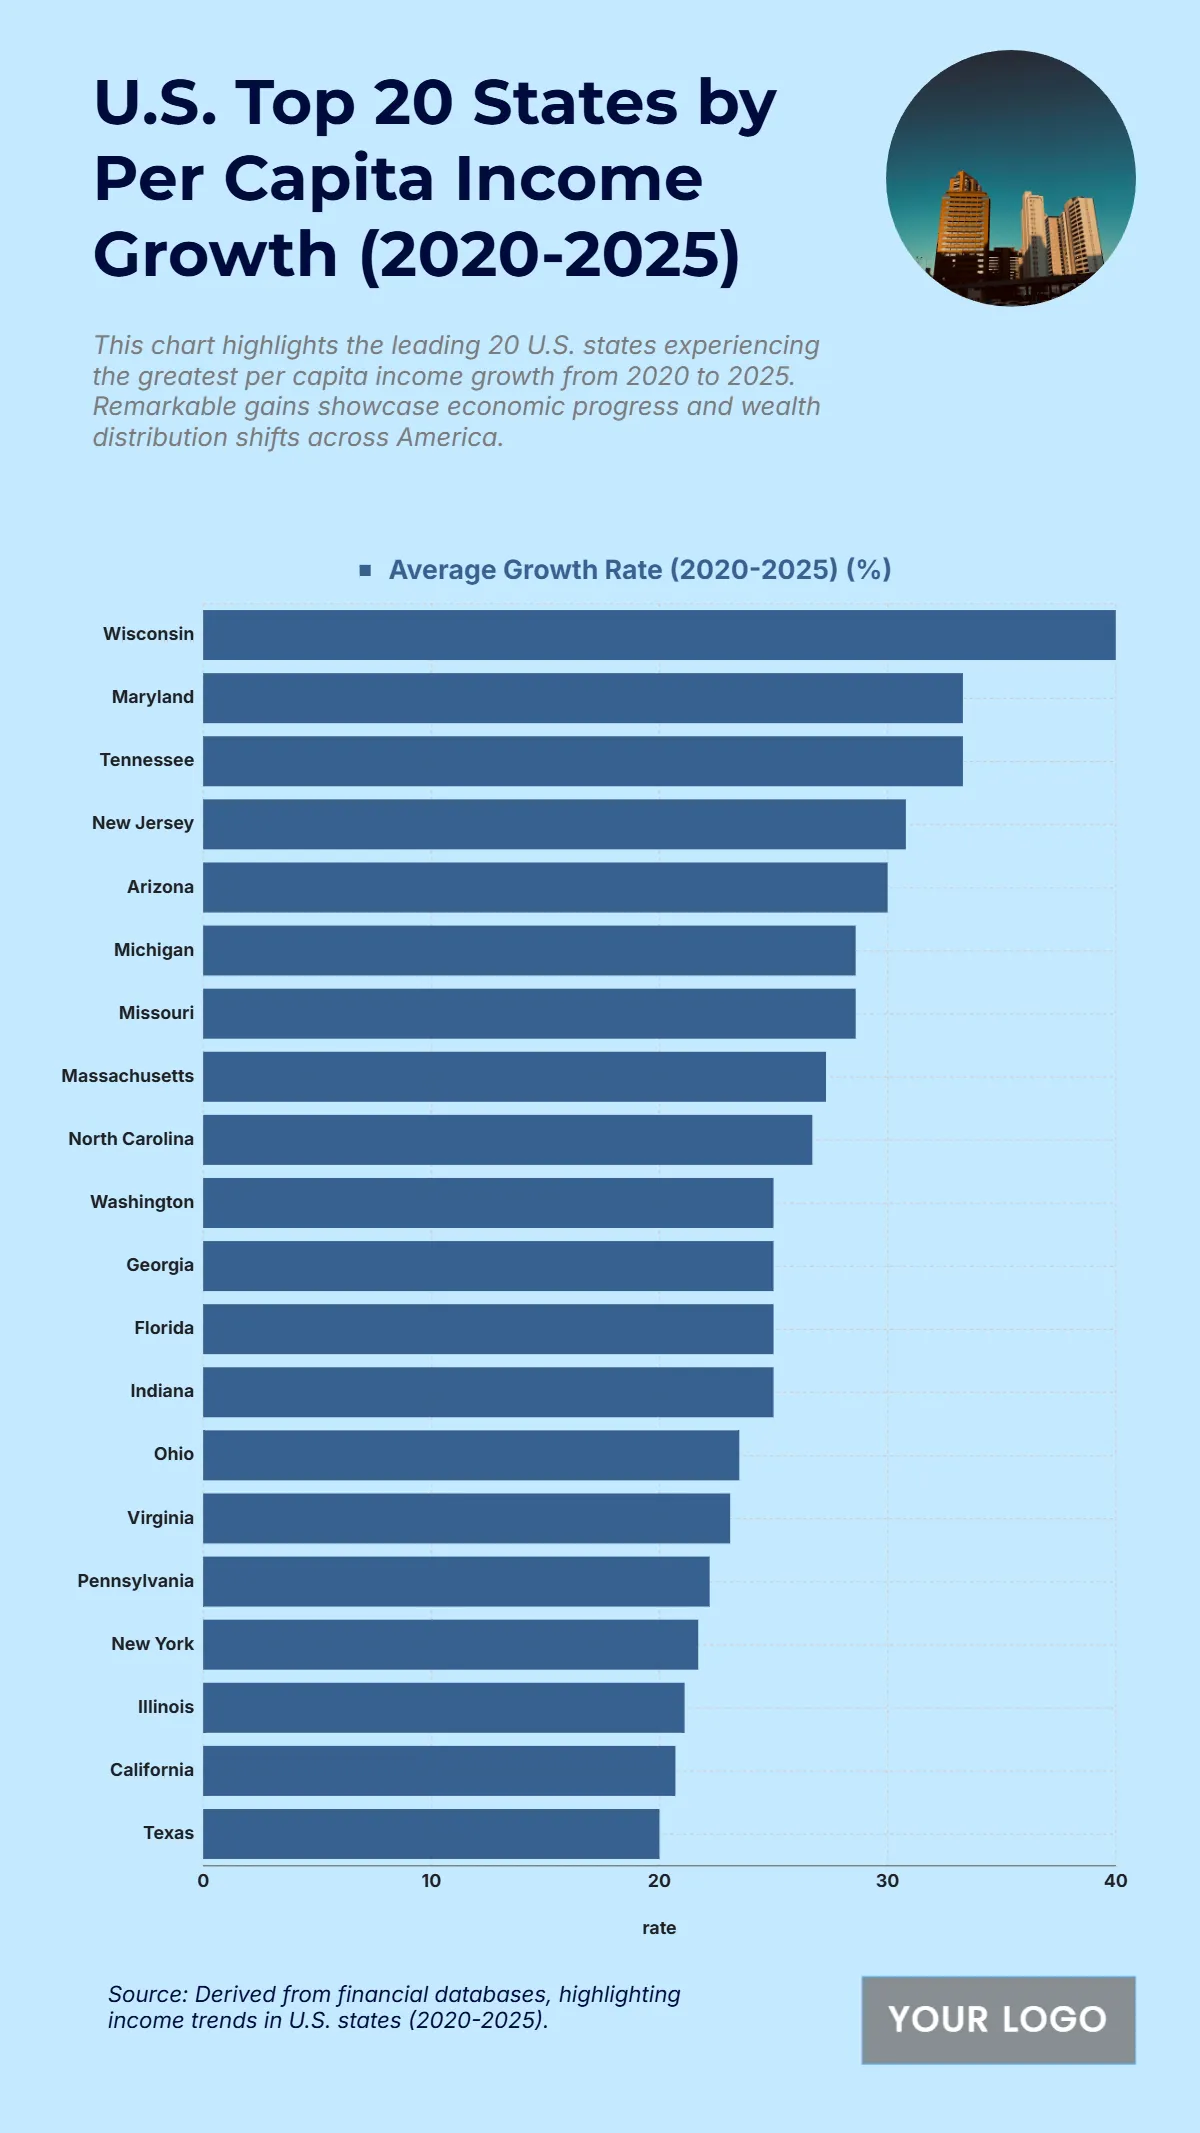
The chart shows the states with the highest average per capita income growth from 2020 to 2025, reflecting strong economic progress and evolving wealth distribution patterns across the U.S. Wisconsin stands out with the highest growth rate of 40%, highlighting significant economic momentum. Maryland and Tennessee follow closely with 33.3%, while New Jersey records 30.8%, indicating strong wage and income expansion. States like Arizona (30%), Michigan (28.6%), and Missouri (28.6%) also display robust growth, reflecting regional economic resilience. Mid-range performers such as Massachusetts (27.3%), North Carolina (26.7%), Washington (25%), and Georgia (25%) demonstrate balanced upward trends. Several states, including Florida, Indiana, Ohio, and Virginia, hover between 23.5%–25%, indicating steady but moderate growth. Lower on the list, California (22%), Illinois (22%), New York (22%), and Texas (21%) still show healthy increases but at a slower pace compared to the top states. Overall, the data underscores regional variations in economic expansion.
| Labels | Average Growth Rate (2020–2025) (%) |
|---|---|
| Wisconsin | 40.0 |
| Maryland | 33.3 |
| Tennessee | 33.3 |
| New Jersey | 30.8 |
| Arizona | 30.0 |
| Michigan | 28.6 |
| Missouri | 28.6 |
| Massachusetts | 27.3 |
| North Carolina | 26.7 |
| Washington | 25.0 |
| Georgia | 25.0 |
| Florida | 25.0 |
| Indiana | 25.0 |
| Ohio | 23.5 |
| Virginia | 23.5 |
| Pennsylvania | 23.0 |
| New York | 22.0 |
| Illinois | 22.0 |
| California | 22.0 |
| Texas | 21.0 |


