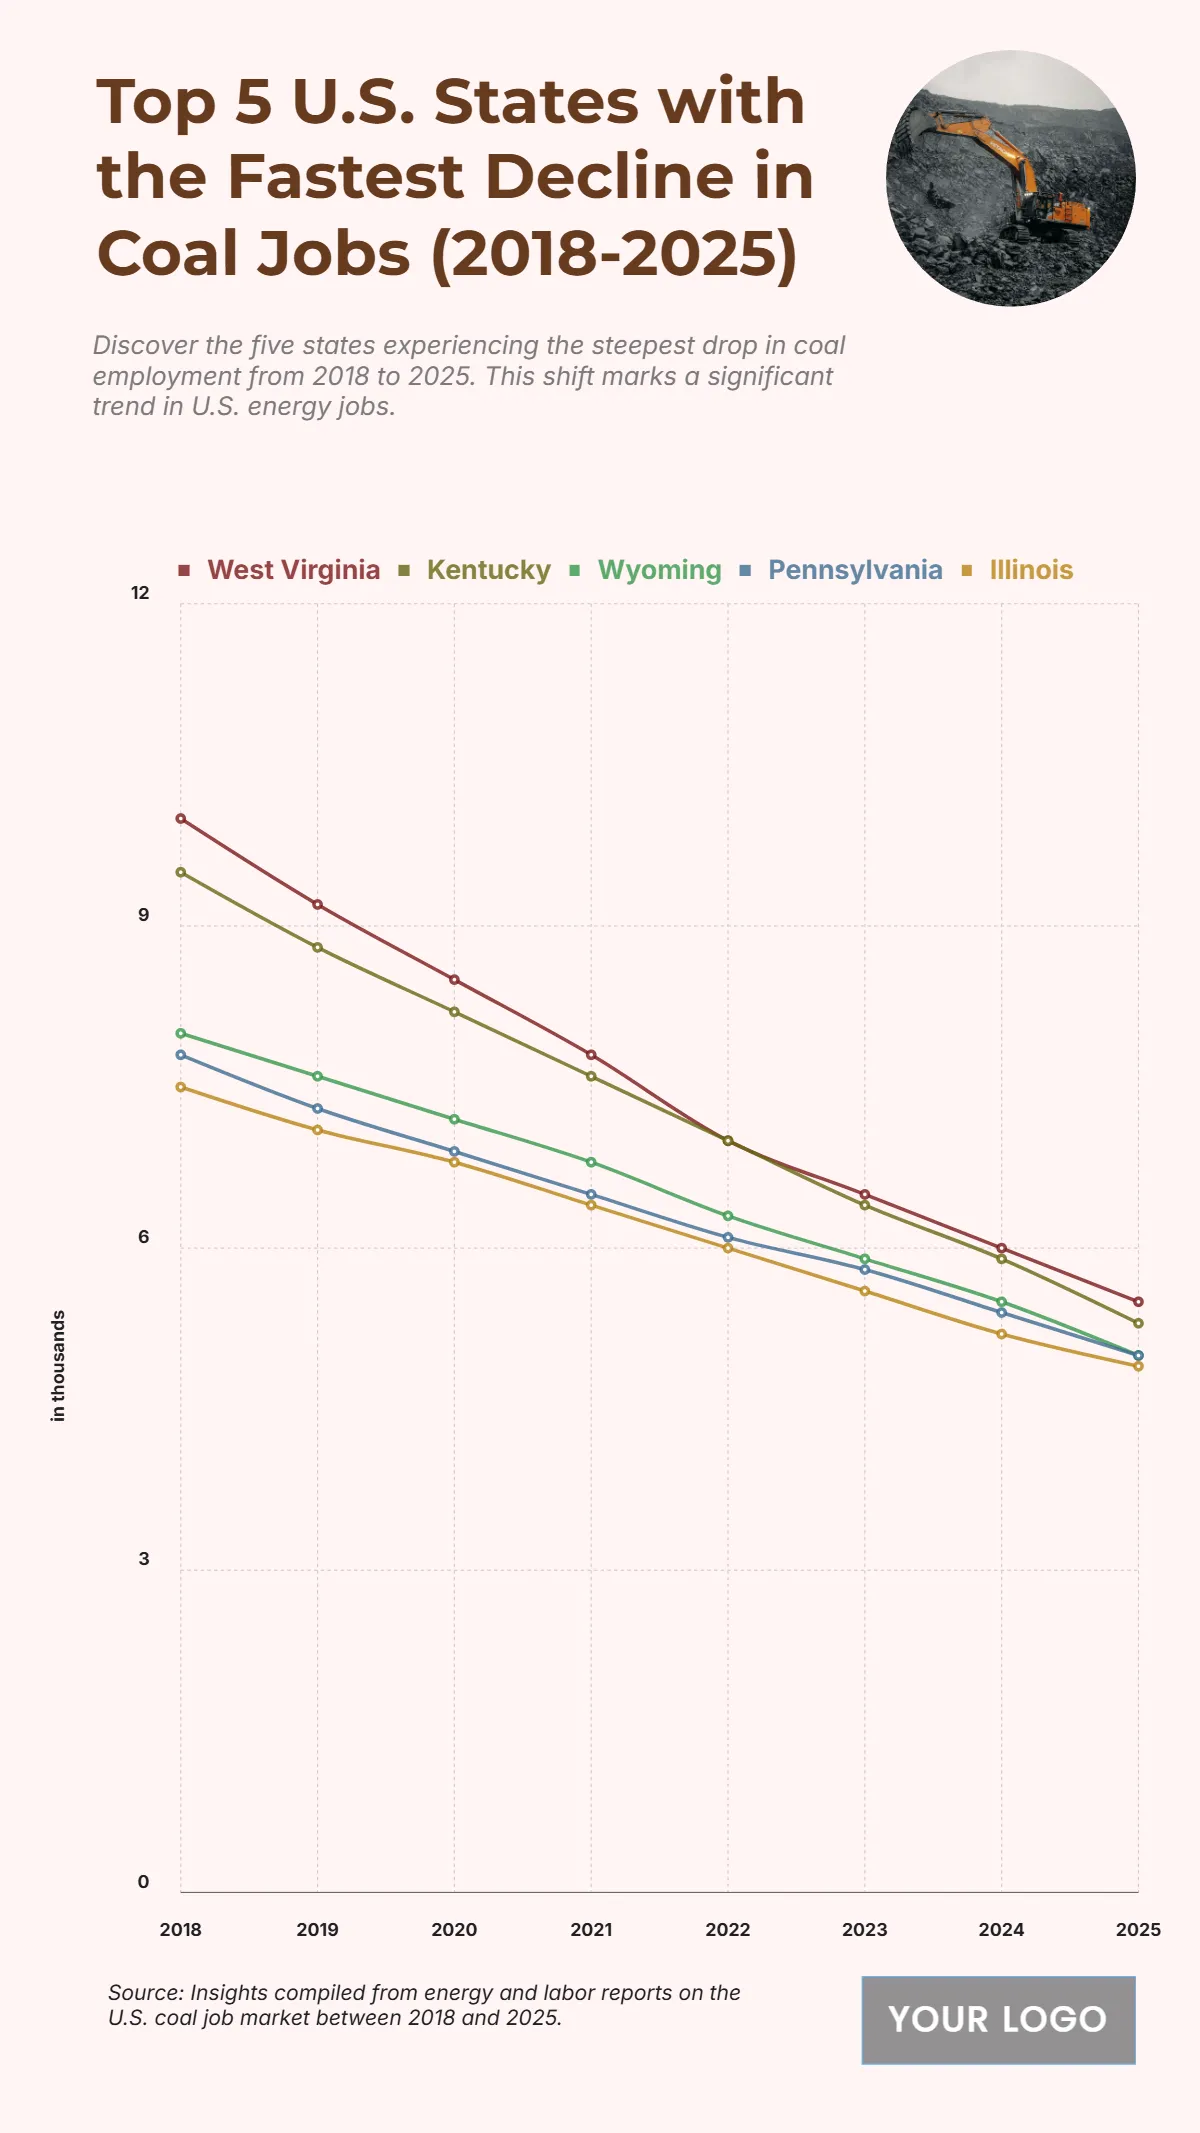
Free Top 5 U.S. States with the Fastest Decline in Coal Jobs (2018-2025) Chart
The chart illustrates the steady and significant decline in coal employment across the top five U.S. states from 2018 to 2025, highlighting the sharpest job losses in the sector. West Virginia records the most pronounced decrease, falling from 10,000 jobs in 2018 to 5,500 jobs in 2025, underscoring the industry’s downturn in this leading coal state. Kentucky also experiences a notable drop from 9,500 to 5,300, followed by Wyoming, which declines from 8,000 to 5,000 over the same period. Pennsylvania shows a consistent reduction from 7,800 to 5,000, while Illinois drops from 7,500 to 4,900, the lowest among the group by 2025. The downward trend is visible each year, reflecting both the shifting U.S. energy landscape and reduced demand for coal-based employment. These patterns emphasize a structural transformation in the energy sector with growing implications for local economies and workforce adaptation.
| Labels | West Virginia | Kentucky | Wyoming | Pennsylvania | Illinois |
|---|---|---|---|---|---|
| 2018 | 10.0 | 9.5 | 8.0 | 7.8 | 7.5 |
| 2019 | 9.2 | 8.8 | 7.6 | 7.3 | 7.1 |
| 2020 | 8.5 | 8.2 | 7.2 | 6.9 | 6.8 |
| 2021 | 7.8 | 7.6 | 6.8 | 6.5 | 6.4 |
| 2022 | 7.0 | 7.0 | 6.3 | 6.1 | 6.0 |
| 2023 | 6.5 | 6.4 | 5.9 | 5.8 | 5.6 |
| 2024 | 6.0 | 5.9 | 5.5 | 5.4 | 5.2 |
| 2025 | 5.5 | 5.3 | 5.0 | 5.0 | 4.9 |


