Free U.S. Top 5 States by Manufacturing Output (2015-2025) Chart
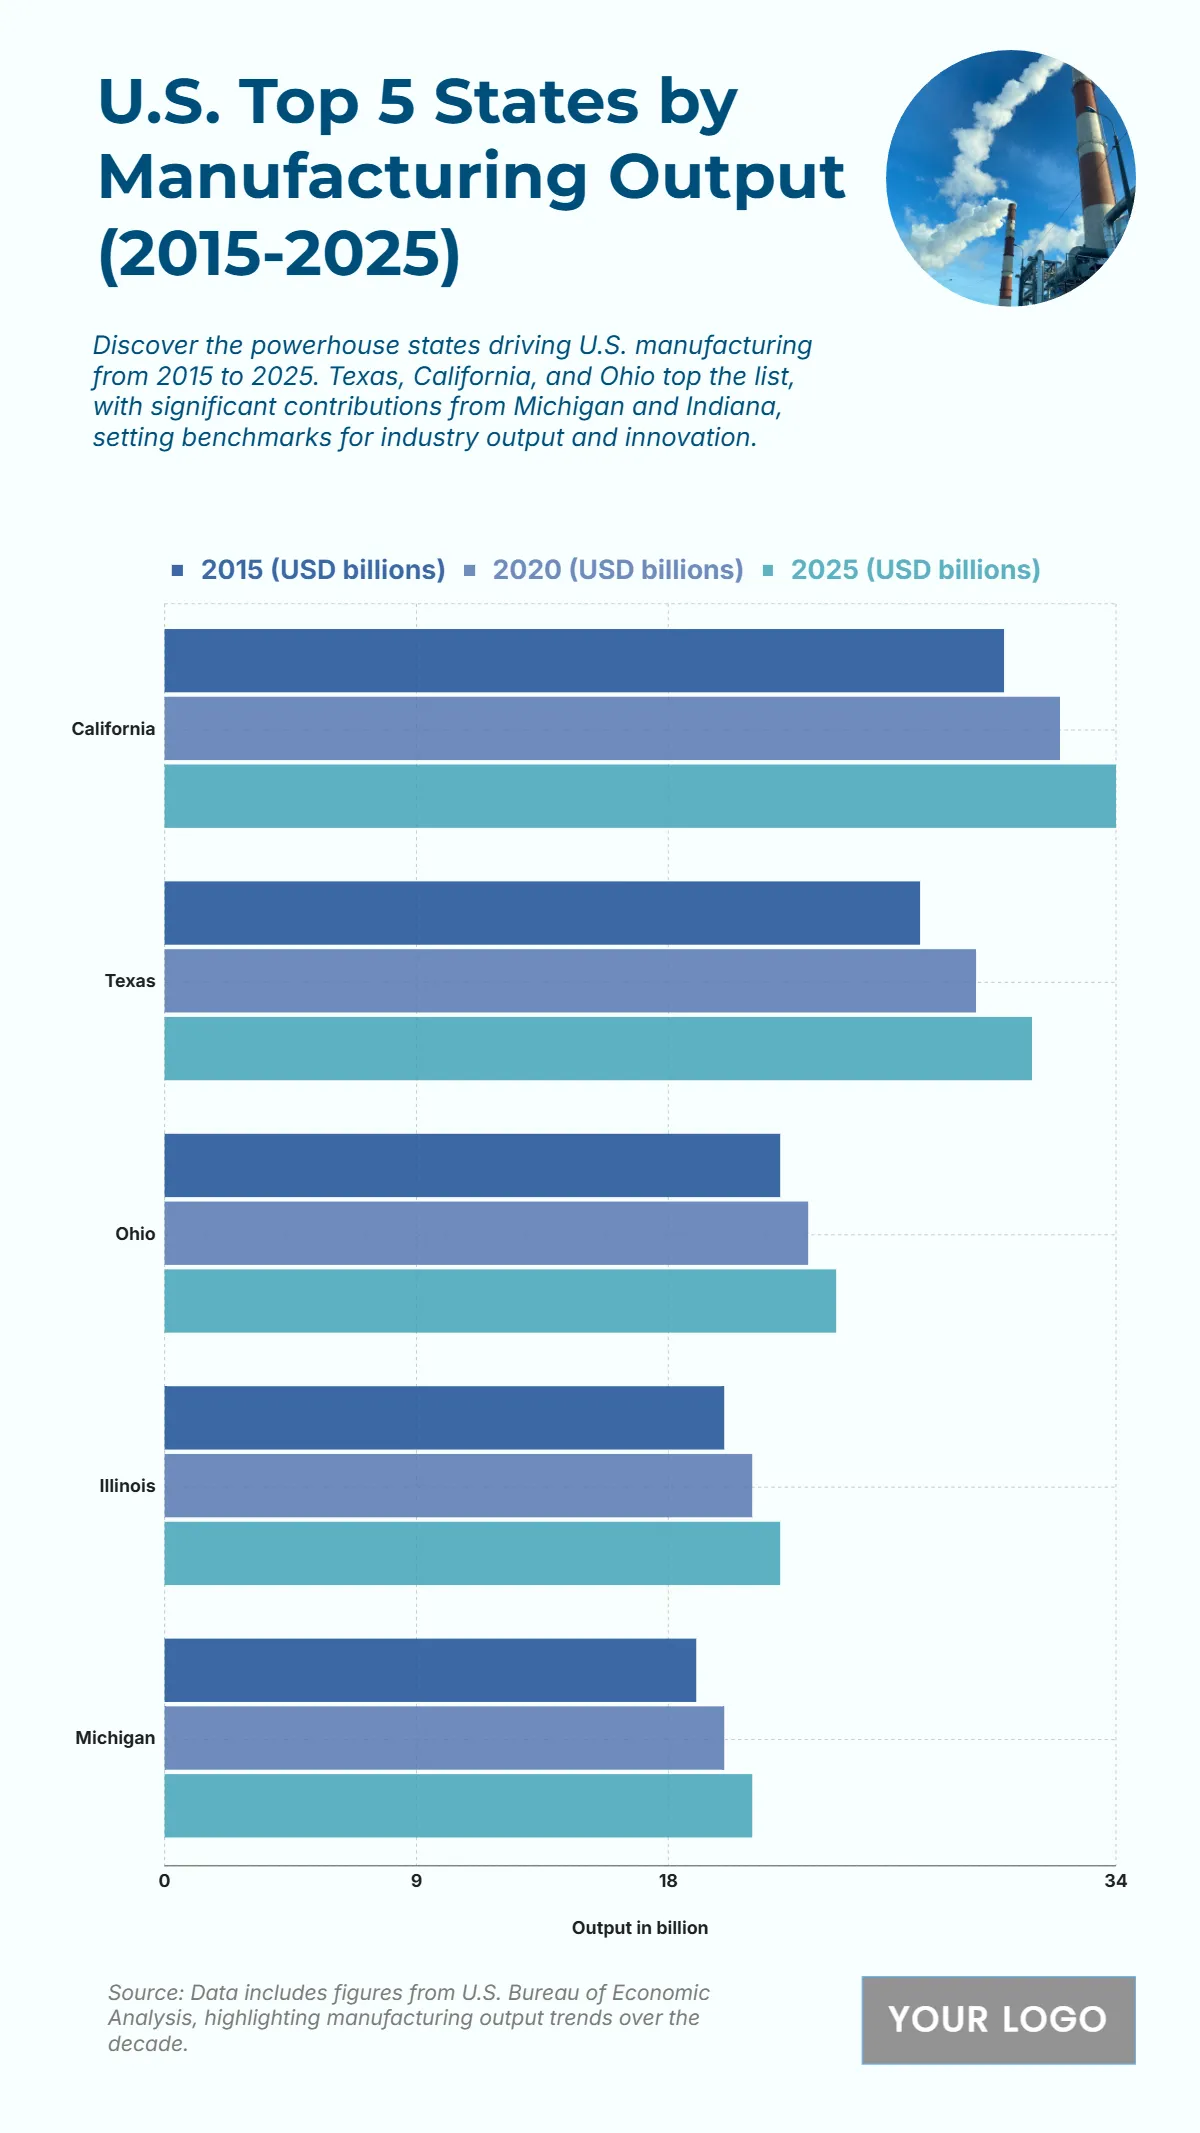
The chart shows consistent growth in manufacturing output from 2015 to 2025 across the top five U.S. states. California leads with USD 30 billion in 2015, increasing to USD 32 billion in 2020 and reaching a projected USD 34 billion in 2025, highlighting its robust industrial sector. Texas follows with USD 27 billion in 2015, growing to USD 29 billion in 2020 and USD 31 billion in 2025, showcasing its steady expansion in manufacturing. Ohio maintains strong performance, rising from USD 22 billion to USD 24 billion over the same period, reflecting stable production levels. Illinois records growth from USD 20 billion in 2015 to USD 22 billion in 2025, while Michigan increases from USD 19 billion to USD 21 billion, showing sustained contributions to U.S. manufacturing. Overall, the upward trend illustrates a healthy and expanding industrial economy across these leading states.
| Labels | 2015 (USD billions) | 2020 (USD billions) | 2025 (USD billions) |
|---|---|---|---|
| California | 30 | 32 | 34 |
| Texas | 27 | 29 | 31 |
| Ohio | 22 | 23 | 24 |
| Illinois | 20 | 21 | 22 |
| Michigan | 19 | 20 | 21 |


