Free Top 10 U.S. States with the Highest State & Local Tax Burden (2018-2025) Chart
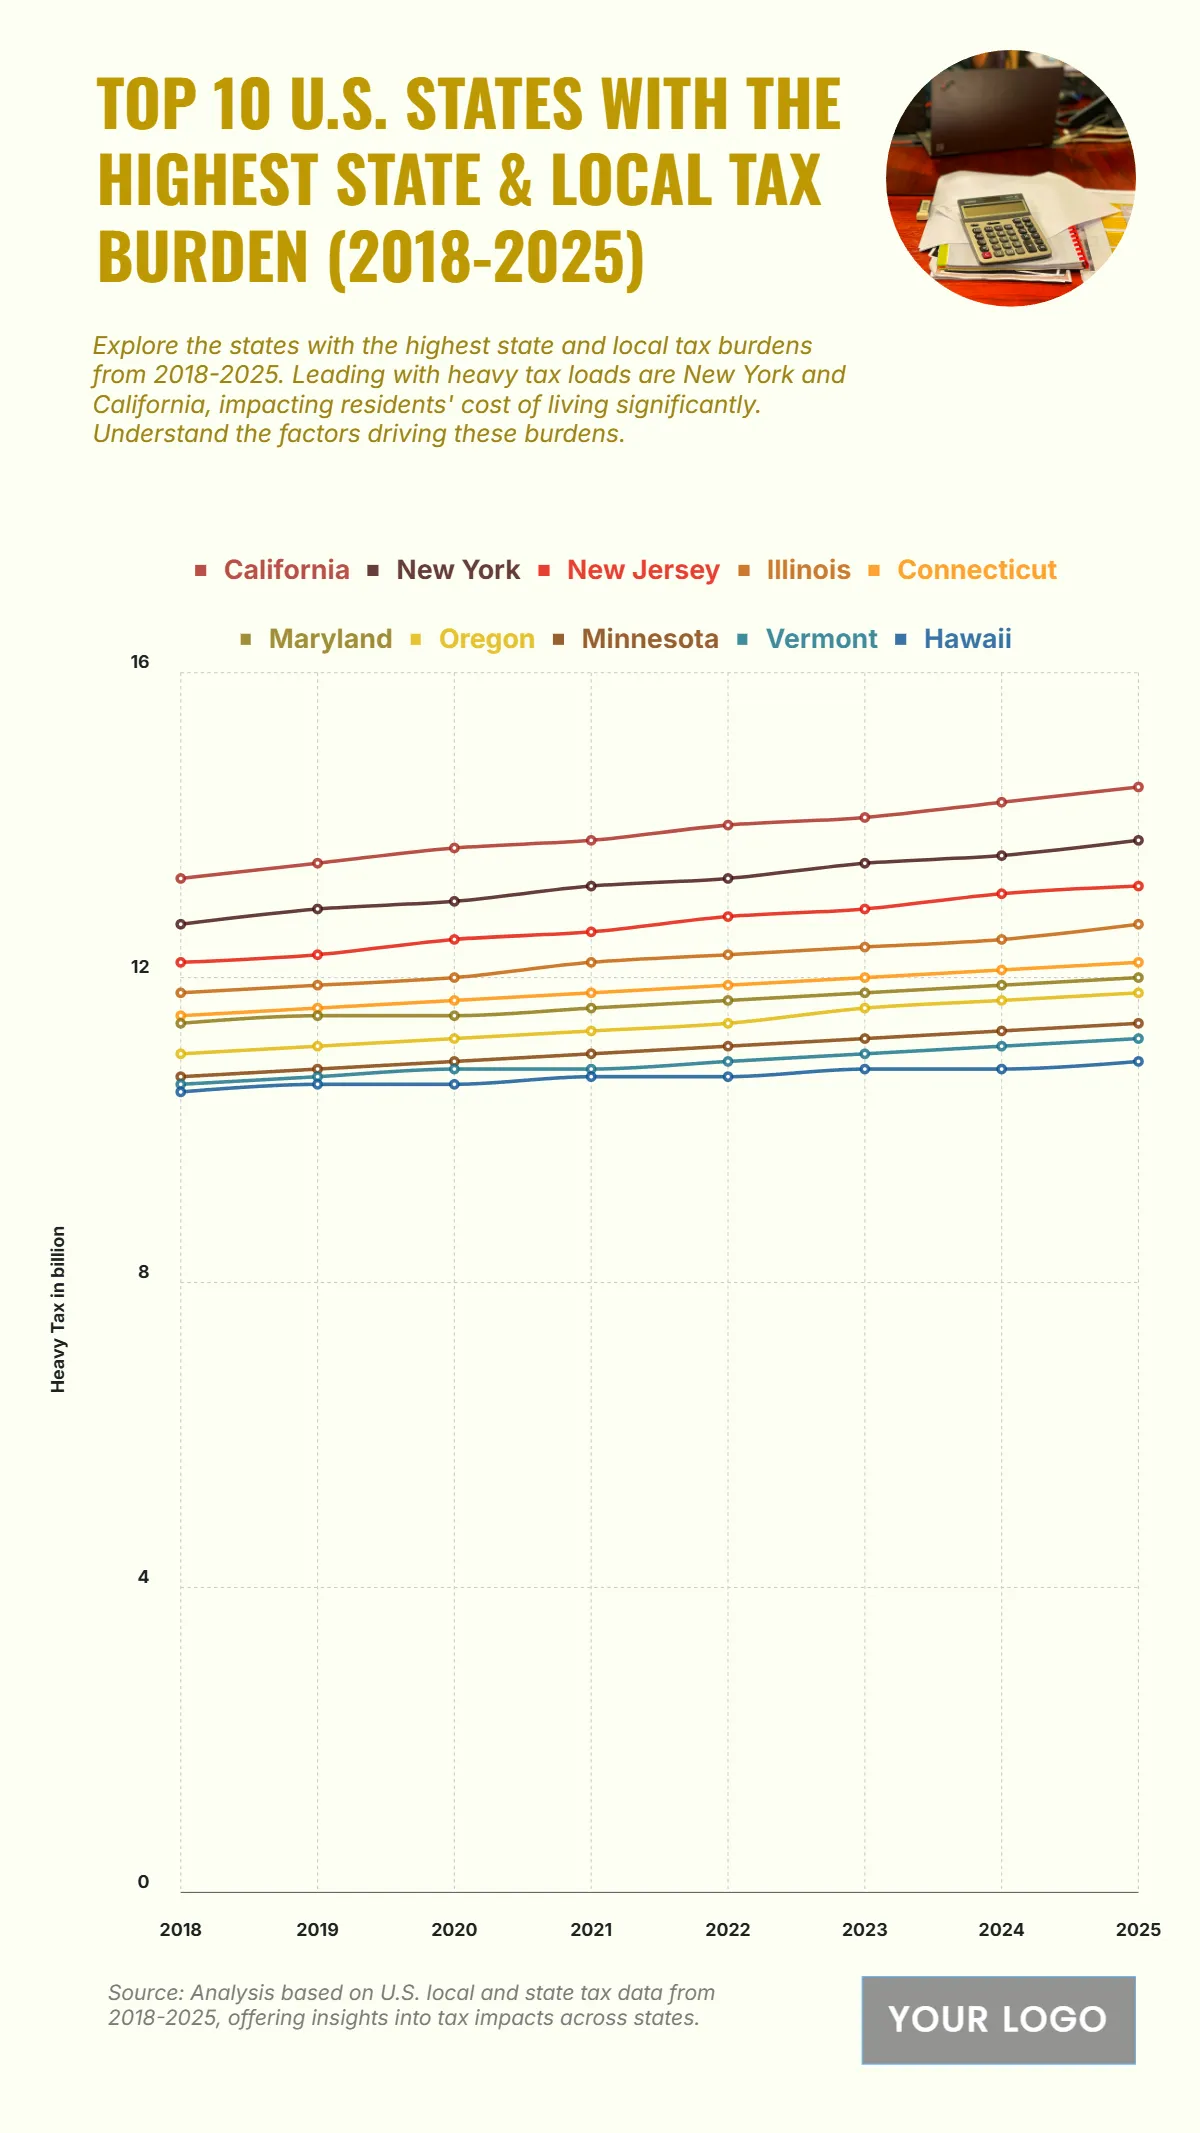
The chart illustrates a gradual rise in state and local tax burdens from 2018 to 2025, led by California, which increases from 13.3% in 2018 to 14.5% in 2025, reflecting the heaviest tax load among all states. New York follows closely, rising from 12.7% to 13.8%, while New Jersey grows from 12.2% to 13.2%. Illinois records a moderate increase from 11.8% to 12.7%, and Connecticut grows from 11.5% to 12.2%. Mid-tier states like Maryland and Oregon rise steadily to 12% and 11.8% respectively by 2025, while Minnesota reaches 11.4%. Meanwhile, Vermont moves from 10.6% to 11.2%, and Hawaii from 10.5% to 10.9%, showing more modest growth compared to high-burden states. Overall, the upward trend across all states highlights increasing fiscal pressures on residents, with California and New York maintaining the highest tax rates throughout the period.
| Labels | California | New York | New Jersey | Illinois | Connecticut | Maryland | Oregon | Minnesota | Vermont | Hawaii |
|---|---|---|---|---|---|---|---|---|---|---|
| 2018 | 13.3 | 12.7 | 12.2 | 11.8 | 11.5 | 11.4 | 11 | 10.7 | 10.6 | 10.5 |
| 2019 | 13.5 | 12.9 | 12.3 | 11.9 | 11.6 | 11.5 | 11.1 | 10.8 | 10.7 | 10.6 |
| 2020 | 13.7 | 13 | 12.5 | 12 | 11.7 | 11.5 | 11.2 | 10.9 | 10.8 | 10.6 |
| 2021 | 13.8 | 13.2 | 12.6 | 12.2 | 11.8 | 11.6 | 11.3 | 11 | 10.8 | 10.7 |
| 2022 | 14 | 13.3 | 12.8 | 12.3 | 11.9 | 11.7 | 11.4 | 11.1 | 10.9 | 10.7 |
| 2023 | 14.1 | 13.5 | 12.9 | 12.4 | 12 | 11.8 | 11.6 | 11.2 | 11 | 10.8 |
| 2024 | 14.3 | 13.6 | 13.1 | 12.5 | 12.1 | 11.9 | 11.7 | 11.3 | 11.1 | 10.8 |
| 2025 | 14.5 | 13.8 | 13.2 | 12.7 | 12.2 | 12 | 11.8 | 11.4 | 11.2 | 10.9 |


