Free Top 10 U.S. States by Household Savings Rate (2020-2025) Chart
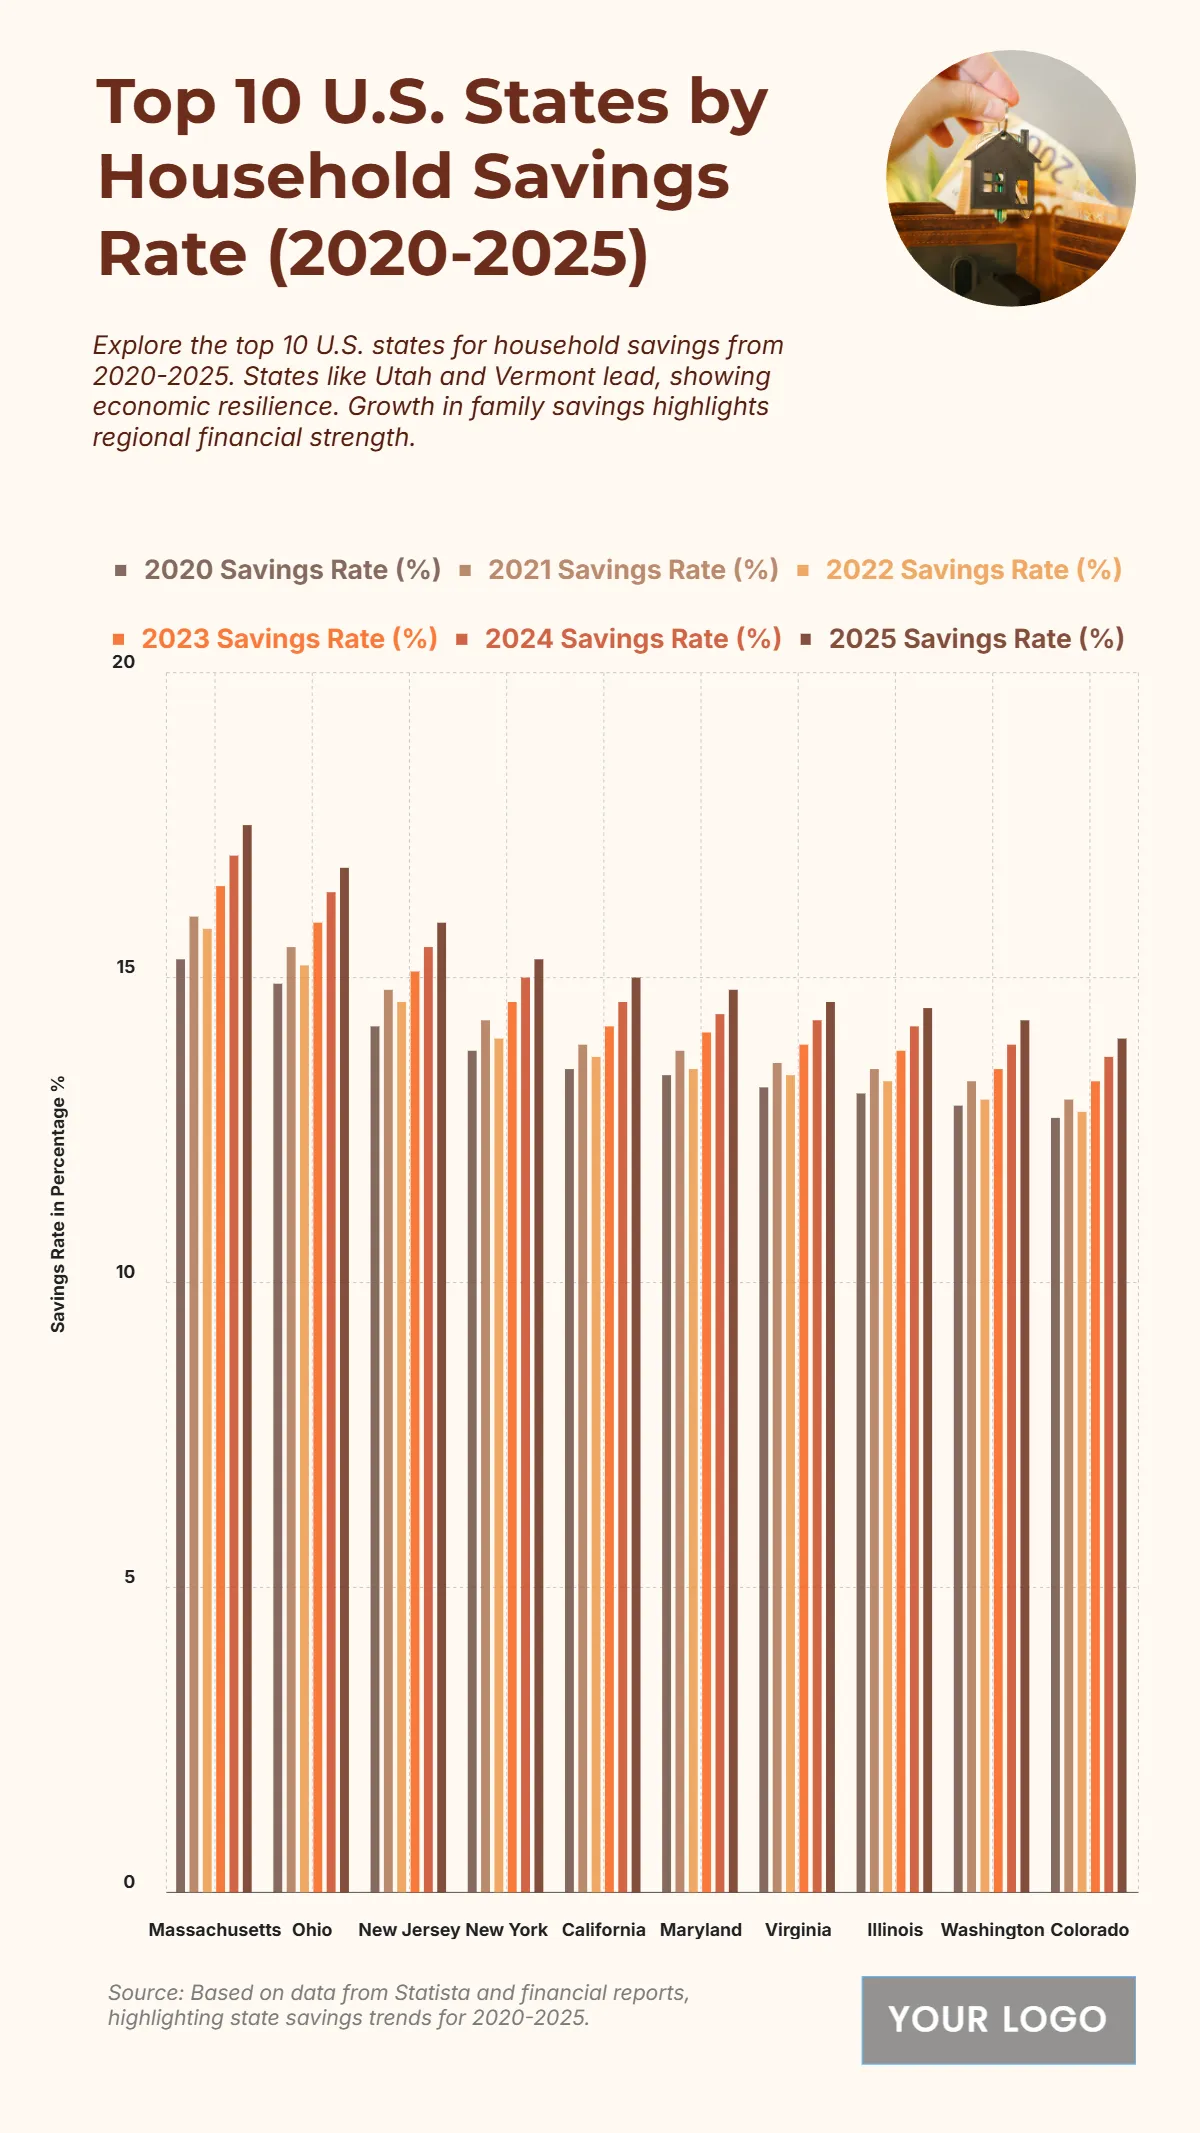
The chart shows a steady rise in household savings rates across leading U.S. states between 2020 and 2025, reflecting increased financial resilience. Massachusetts leads with a jump from 15.3% in 2020 to 17.5% in 2025, demonstrating the strongest savings performance. Ohio follows, increasing from 14.9% to 16.8%, while New Jersey grows from 14.2% to 15.9%. New York improves from 13.8% to 15.3%, and California rises from 13.5% to 15%. Maryland moves from 13.4% to 14.8%, Virginia from 13.2% to 14.6%, and Illinois from 13.1% to 14.5%. Meanwhile, Washington climbs from 12.9% to 14.3%, and Colorado grows from 12.7% to 14%, rounding out the top ten. This consistent upward trend highlights how households across different states are strengthening their savings habits in response to evolving economic conditions.
| Labels | 2020 Savings Rate (%) | 2021 Savings Rate (%) | 2022 Savings Rate (%) | 2023 Savings Rate (%) | 2024 Savings Rate (%) | 2025 Savings Rate (%) |
|---|---|---|---|---|---|---|
| Massachusetts | 15.3 | 16 | 15.8 | 16.5 | 17 | 17.5 |
| Ohio | 14.9 | 15.5 | 15.2 | 15.9 | 16.4 | 16.8 |
| New Jersey | 14.2 | 14.8 | 14.6 | 15.1 | 15.5 | 15.9 |
| New York | 13.8 | 14.3 | 14 | 14.6 | 15 | 15.3 |
| California | 13.5 | 13.9 | 13.7 | 14.2 | 14.6 | 15 |
| Maryland | 13.4 | 13.8 | 13.5 | 14.1 | 14.4 | 14.8 |
| Virginia | 13.2 | 13.6 | 13.4 | 13.9 | 14.3 | 14.6 |
| Illinois | 13.1 | 13.5 | 13.3 | 13.8 | 14.2 | 14.5 |
| Washington | 12.9 | 13.3 | 13 | 13.5 | 13.9 | 14.3 |
| Colorado | 12.7 | 13 | 12.8 | 13.3 | 13.7 | 14 |


