Free Top 20 U.S. States by Mortgage Delinquency Rates (2018-2025)
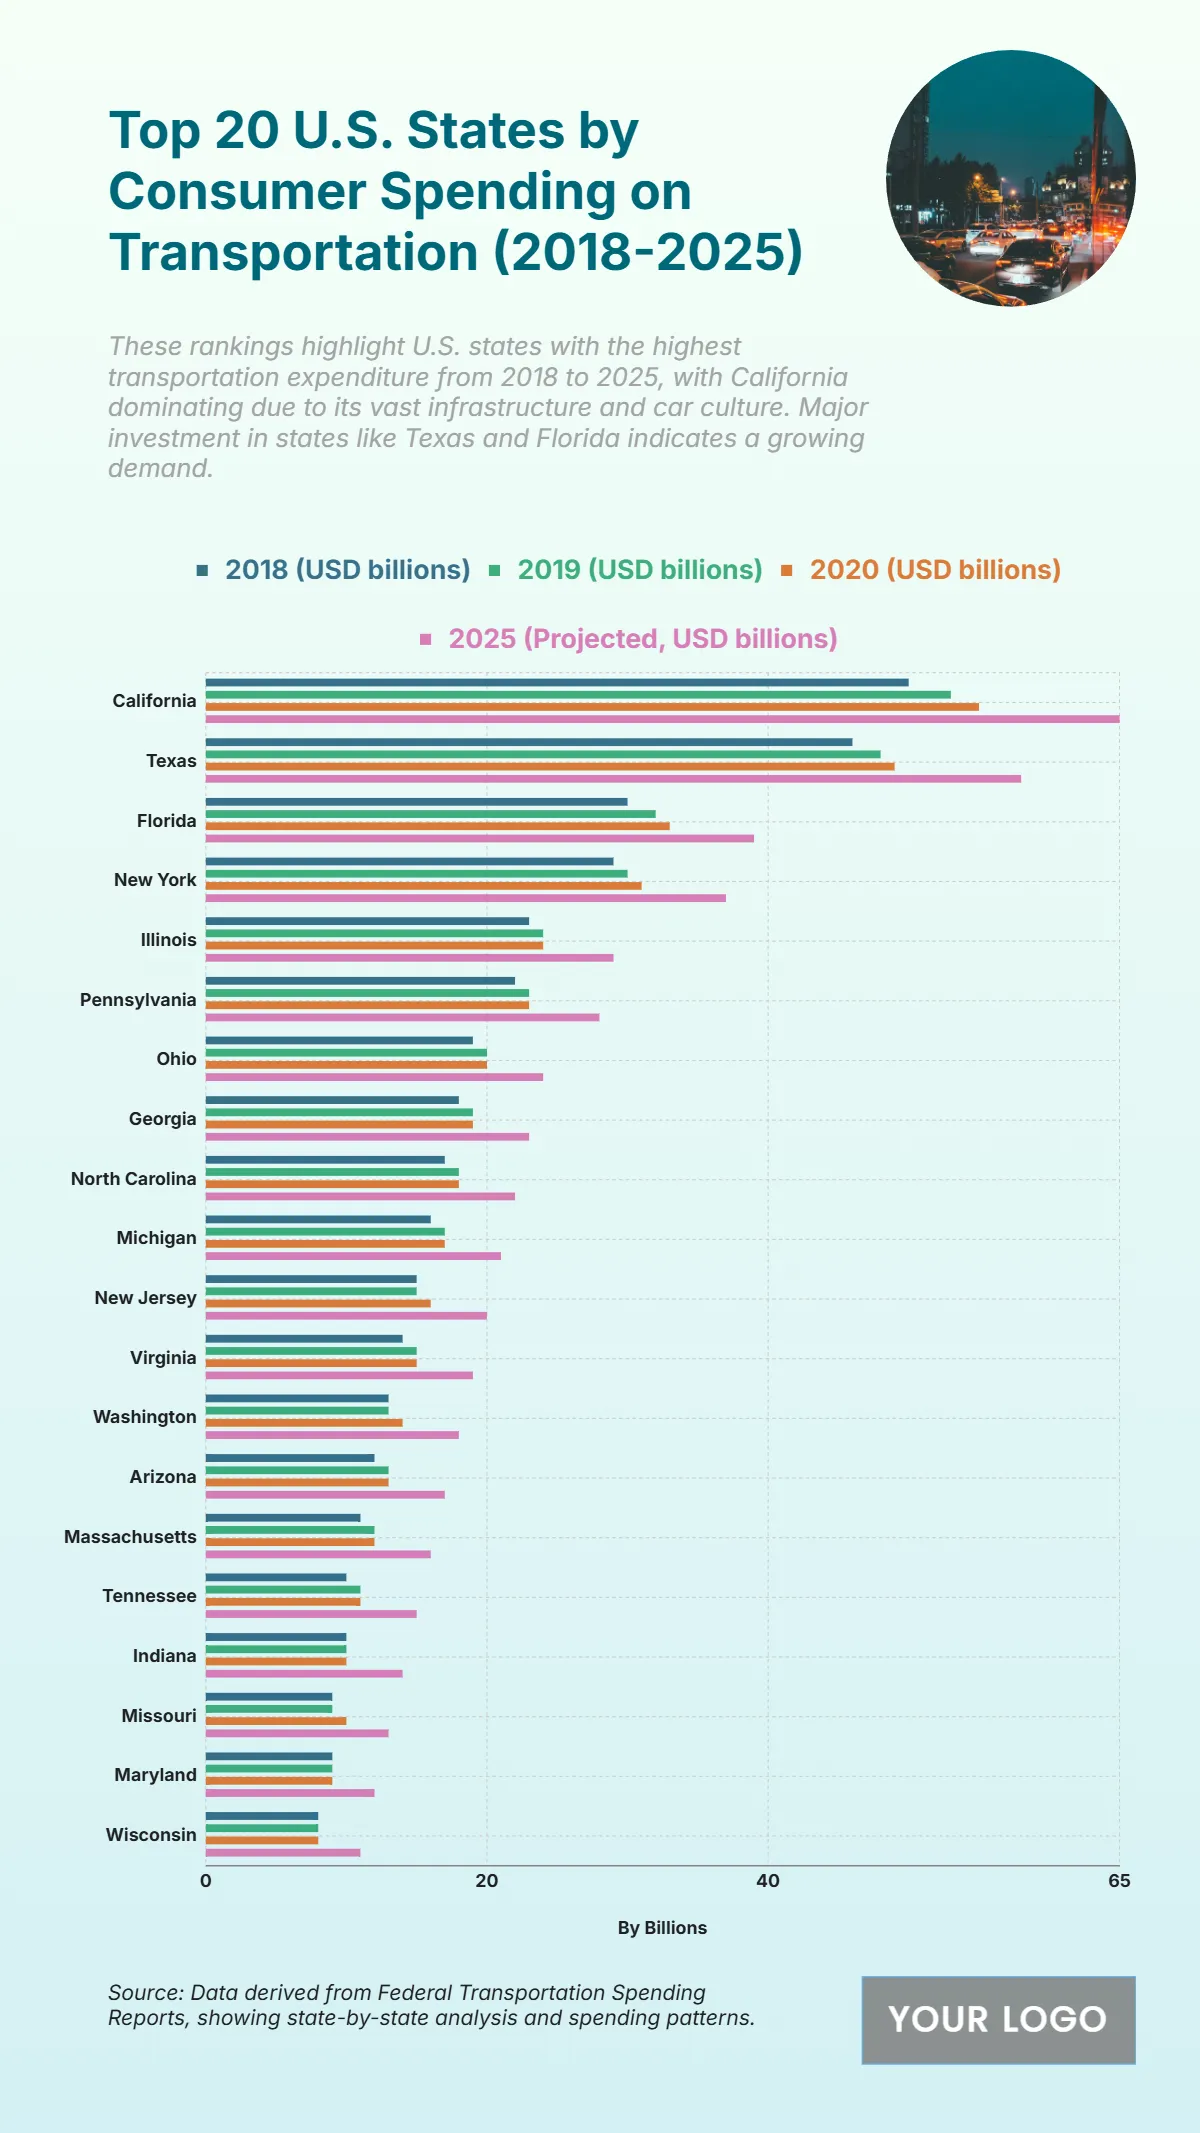
The chart shows a consistent increase in consumer spending on transportation across the top twenty U.S. states from 2018 to 2025, with California leading significantly. Spending in California grew from USD 50 billion in 2018 to a projected USD 65 billion in 2025, emphasizing its strong infrastructure and vehicle usage. Texas follows with a rise from USD 46 billion to USD 58 billion, while Florida increases from USD 30 billion to USD 39 billion. New York also shows steady growth, moving from USD 29 billion to USD 37 billion. Other states such as Illinois, Pennsylvania, and Ohio display moderate but notable growth, reaching USD 29 billion, USD 28 billion, and USD 24 billion respectively by 2025. States lower in the ranking like Indiana, Maryland, and Wisconsin show smaller figures but maintain upward trends. This reflects the growing demand for transportation investment, infrastructure expansion, and increased mobility needs nationwide.
| Labels | 2018 (USD billions) | 2019 (USD billions) | 2020 (USD billions) | 2025 (Projected, USD billions) |
|---|---|---|---|---|
| California | 50 | 53 | 55 | 65 |
| Texas | 46 | 48 | 49 | 58 |
| Florida | 30 | 32 | 33 | 39 |
| New York | 29 | 30 | 31 | 37 |
| Illinois | 23 | 24 | 24 | 29 |
| Pennsylvania | 22 | 23 | 23 | 28 |
| Ohio | 19 | 20 | 20 | 24 |
| Georgia | 18 | 19 | 19 | 23 |
| North Carolina | 17 | 18 | 18 | 22 |
| Michigan | 16 | 17 | 17 | 21 |
| New Jersey | 15 | 15 | 16 | 20 |
| Virginia | 14 | 15 | 15 | 19 |
| Washington | 13 | 13 | 14 | 18 |
| Arizona | 13 | 13 | 13 | 17 |
| Massachusetts | 11 | 12 | 12 | 16 |
| Tennessee | 10 | 11 | 11 | 15 |
| Indiana | 10 | 10 | 10 | 14 |
| Missouri | 9 | 9 | 9 | 13 |
| Maryland | 9 | 9 | 9 | 12 |
| Wisconsin | 8 | 8 | 8 | 12 |


