Free U.S. Top 5 States by Household Wealth Distribution (2020-2025)
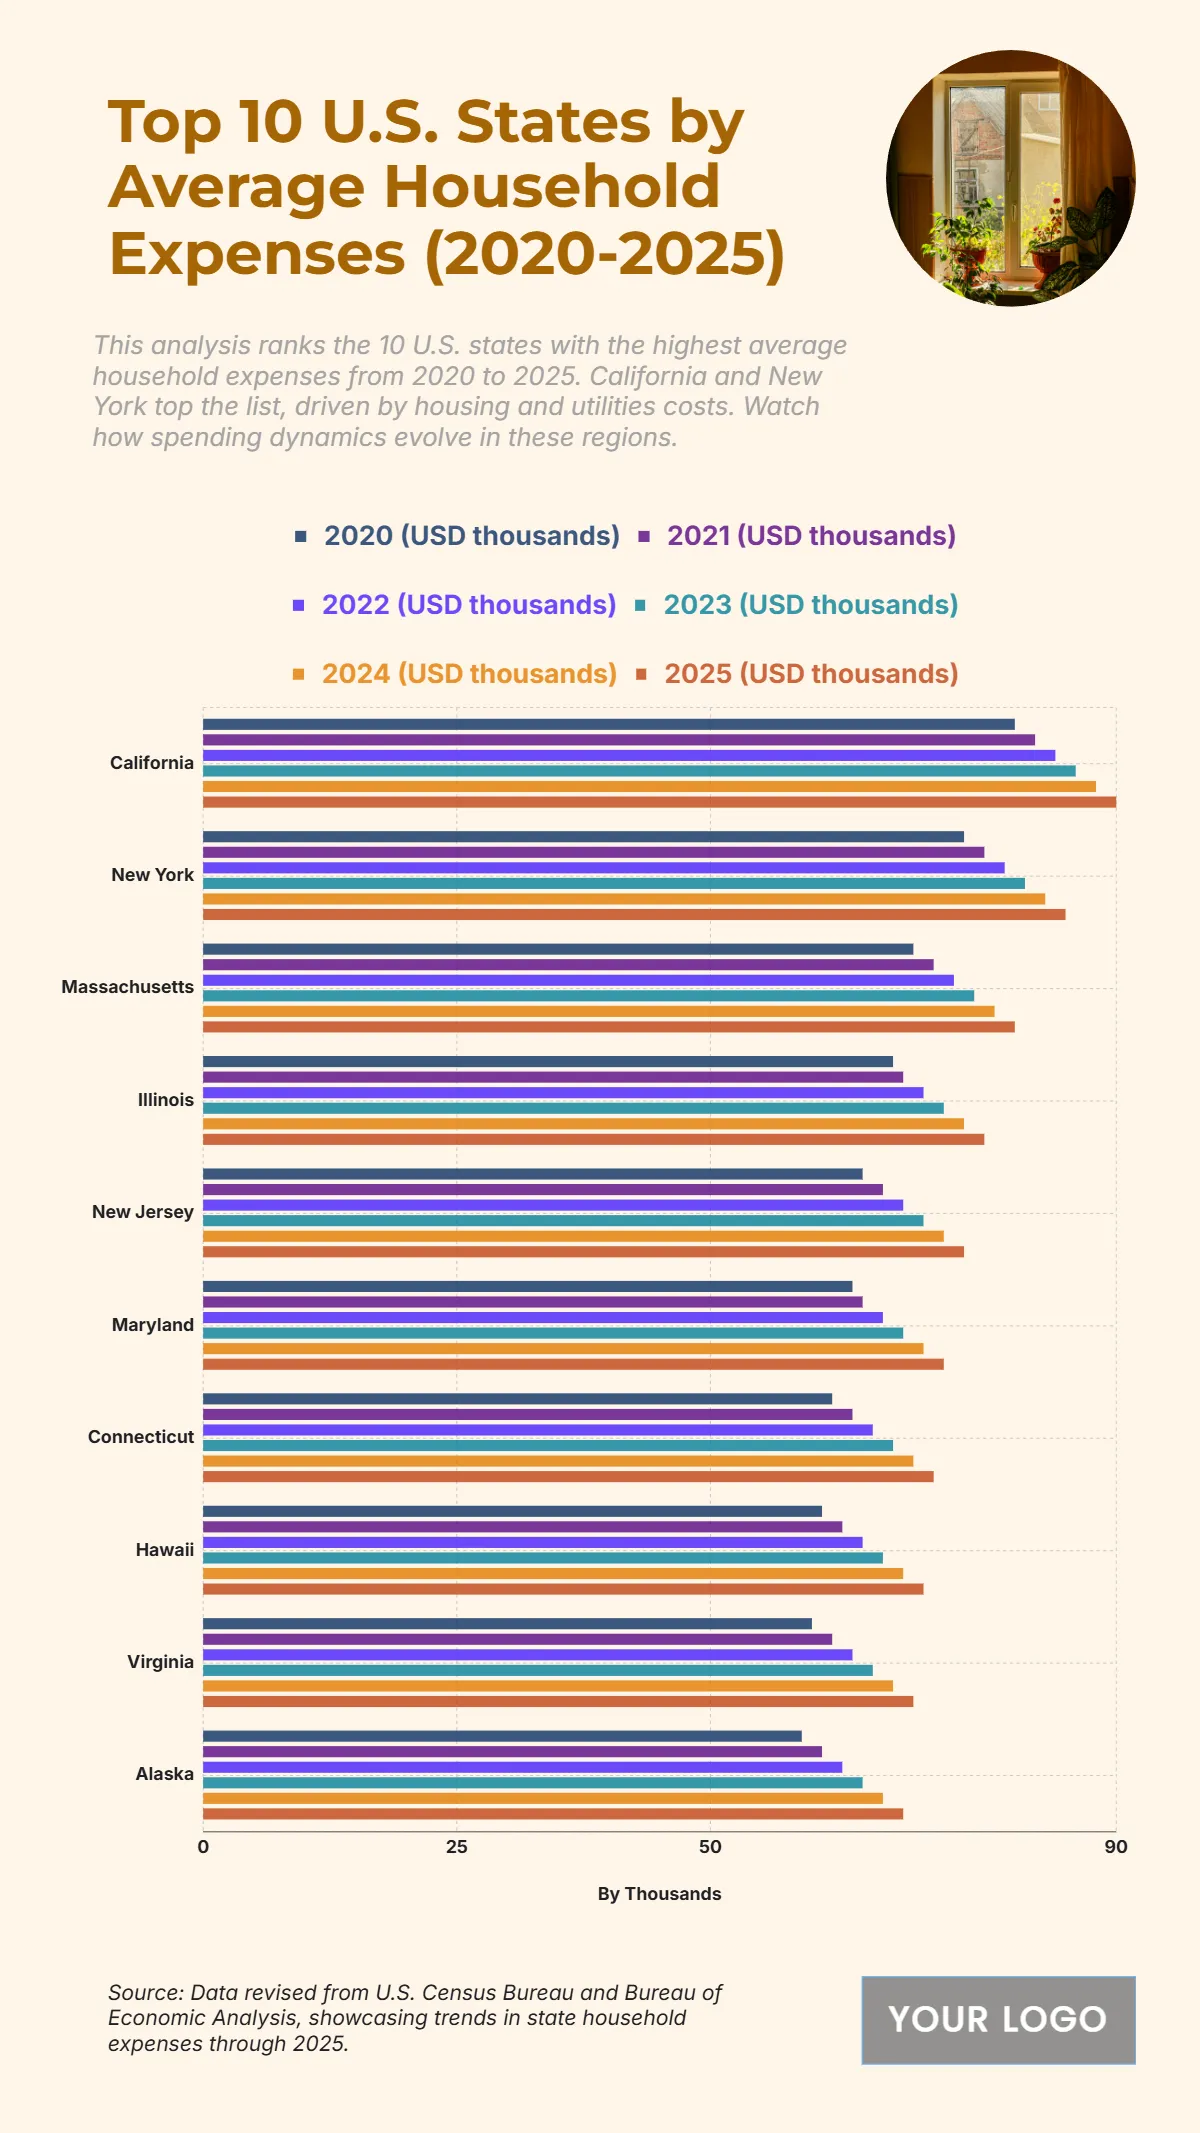
The chart highlights the steady rise in average household expenses across the top ten U.S. states from 2020 to 2025, reflecting increasing costs in essential sectors such as housing, utilities, and daily living. California records the highest expenses, climbing from USD 80 thousand in 2020 to USD 90 thousand by 2025, showcasing a significant increase of USD 10 thousand. New York follows closely with an increase from USD 75 thousand to USD 85 thousand. Massachusetts rises from USD 70 thousand to USD 80 thousand, while Illinois increases from USD 68 thousand to USD 77 thousand. New Jersey moves from USD 65 thousand to USD 75 thousand, while Maryland grows from USD 64 thousand to USD 73 thousand. Connecticut, Hawaii, Virginia, and Alaska also show consistent increases, reaching between USD 69–72 thousand by 2025. This upward trend reflects inflationary pressures and the growing cost of living in economically active states.
| Labels | 2020 (USD thousands) | 2021 (USD thousands) | 2022 (USD thousands) | 2023 (USD thousands) | 2024 (USD thousands) | 2025 (USD thousands) |
|---|---|---|---|---|---|---|
| California | 80 | 82 | 84 | 86 | 88 | 90 |
| New York | 75 | 77 | 79 | 81 | 83 | 85 |
| Massachusetts | 70 | 72 | 74 | 76 | 78 | 80 |
| Illinois | 68 | 69 | 71 | 73 | 75 | 77 |
| New Jersey | 65 | 67 | 69 | 71 | 73 | 75 |
| Maryland | 64 | 65 | 67 | 69 | 71 | 73 |
| Connecticut | 62 | 64 | 66 | 68 | 70 | 72 |
| Hawaii | 61 | 63 | 65 | 67 | 69 | 71 |
| Virginia | 60 | 62 | 64 | 66 | 68 | 70 |
| Alaska | 59 | 61 | 63 | 65 | 67 | 69 |


