Free Top 10 U.S. States by Average Household Expenses (2020-2025)
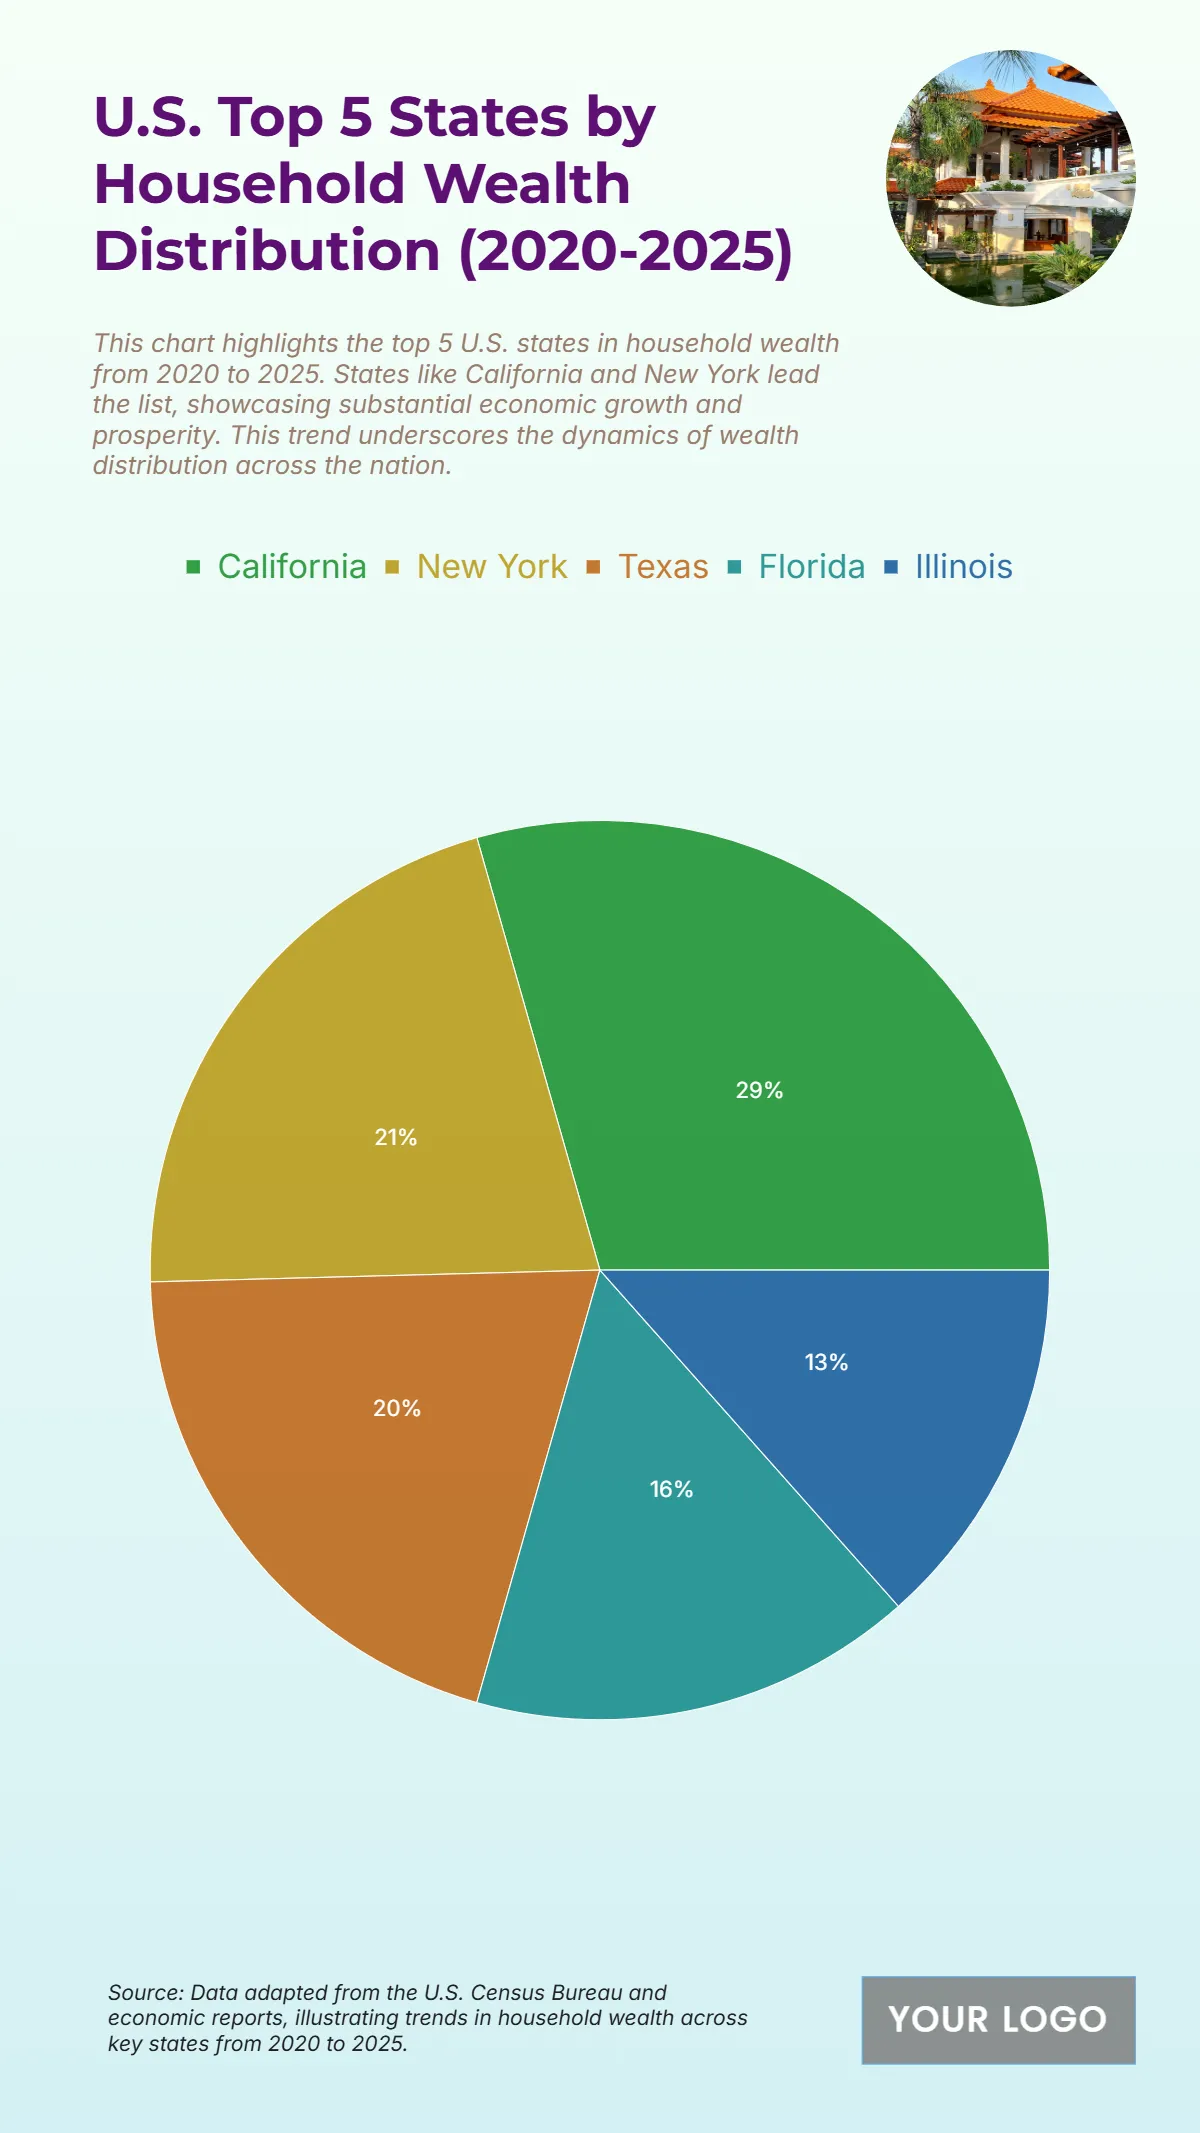
The chart shows that California dominates household wealth distribution from 2020 to 2025, holding an impressive USD 3,500 billion or 29% of the total wealth among the top five states. New York follows with USD 2,500 billion, representing 21%, while Texas secures third place with USD 2,400 billion or 20%. Florida ranks fourth with USD 1,900 billion, accounting for 16% of the total, and Illinois comes fifth with USD 1,600 billion, comprising 13%. The chart highlights a strong concentration of wealth in coastal and economically diverse states like California and New York, where technology, finance, and real estate sectors significantly contribute to prosperity. Meanwhile, the steady growth in Texas and Florida reflects expanding industries and migration-driven economic development. Illinois maintains a solid share due to its industrial and urban centers. Overall, the data illustrates the concentration of household wealth in states driving national economic performance.
| Labels | Wealth in Billion USD |
|---|---|
| California | 3500 |
| New York | 2500 |
| Texas | 2400 |
| Florida | 1900 |
| Illinois | 1600 |


