Free Top 10 U.S. States by Gross State Product (GSP) Growth (2020-2025)
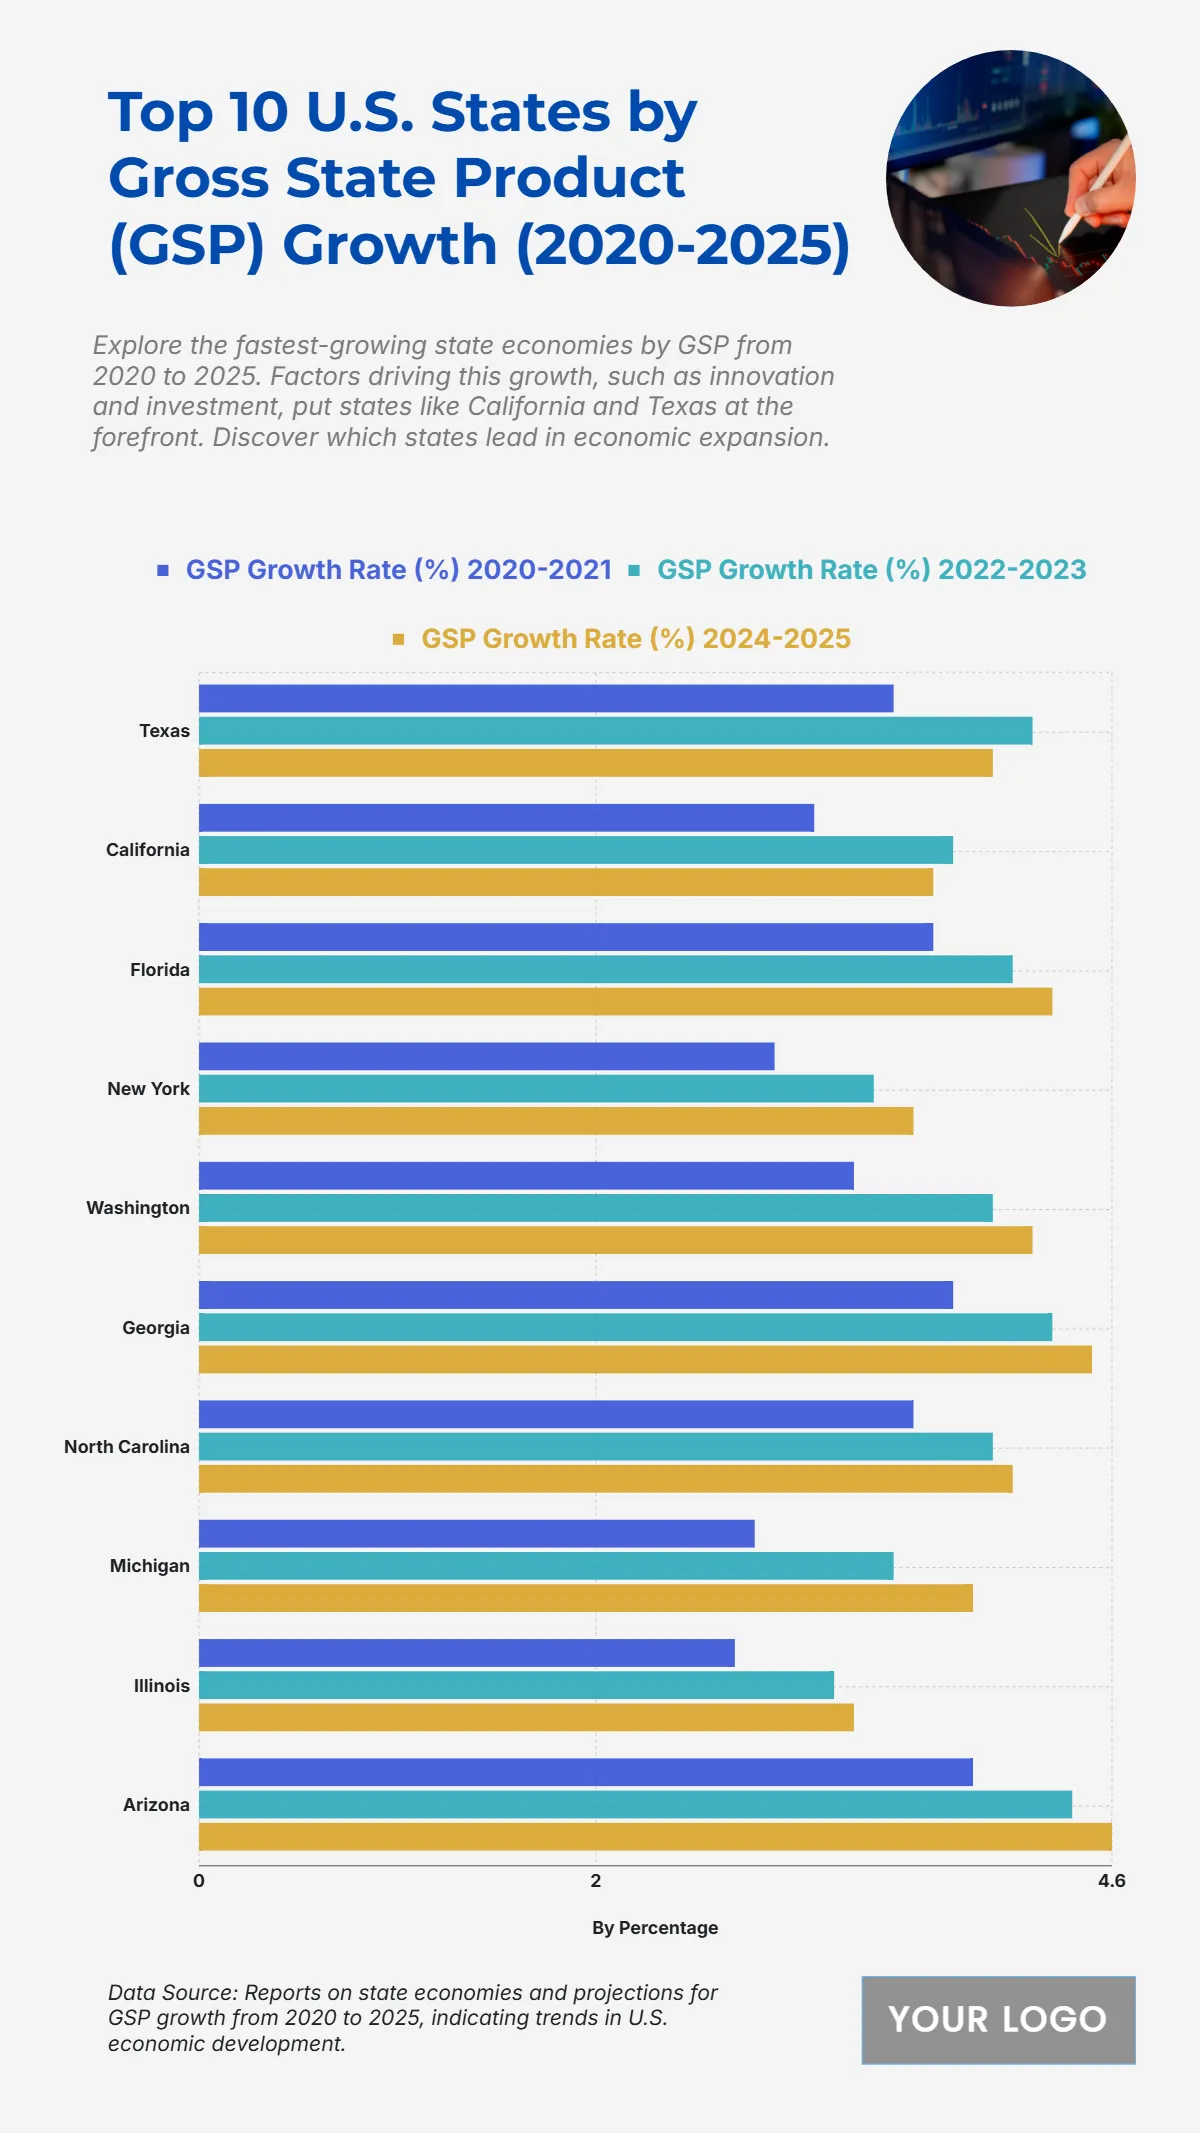
The chart illustrates consistent GSP growth from 2020 to 2025, with Texas maintaining its lead, rising from 3.5% in 2020–2021 to 4.2% in 2022–2023, and then slightly adjusting to 4.0% in 2024–2025. California follows, showing stable increases from 3.1% to 3.8% and reaching 3.7%, reflecting its strong economic base. Florida demonstrates robust expansion, starting at 3.7%, then 4.1%, and peaking at 4.3%, while Georgia rises from 3.8% to 4.3% and hits 4.5%, indicating sustained growth. Arizona records the highest final growth at 4.6%, climbing from 3.9% to 4.4%. Other states like New York, Washington, and North Carolina maintain steady progress, reaching between 3.6% to 4.1% by 2025. Michigan improves from 2.8% to 3.9%, and Illinois grows from 2.7% to 3.3%, showing slower yet positive trends. Overall, the pattern highlights economic momentum across top states, driven by investment and innovation.
| Labels | GSP Growth Rate (%) 2020–2021 | GSP Growth Rate (%) 2022–2023 | GSP Growth Rate (%) 2024–2025 |
|---|---|---|---|
| Texas | 3.5 | 4.2 | 4.0 |
| California | 3.1 | 3.8 | 3.7 |
| Florida | 3.7 | 4.1 | 4.3 |
| New York | 2.9 | 3.4 | 3.6 |
| Washington | 3.3 | 4.0 | 4.2 |
| Georgia | 3.8 | 4.3 | 4.5 |
| North Carolina | 3.6 | 4.0 | 4.1 |
| Michigan | 2.8 | 3.5 | 3.9 |
| Illinois | 2.7 | 3.2 | 3.3 |
| Arizona | 3.9 | 4.4 | 4.6 |


