Free Top 20 U.S. States with the Highest Inflation Rate (2018-2025)
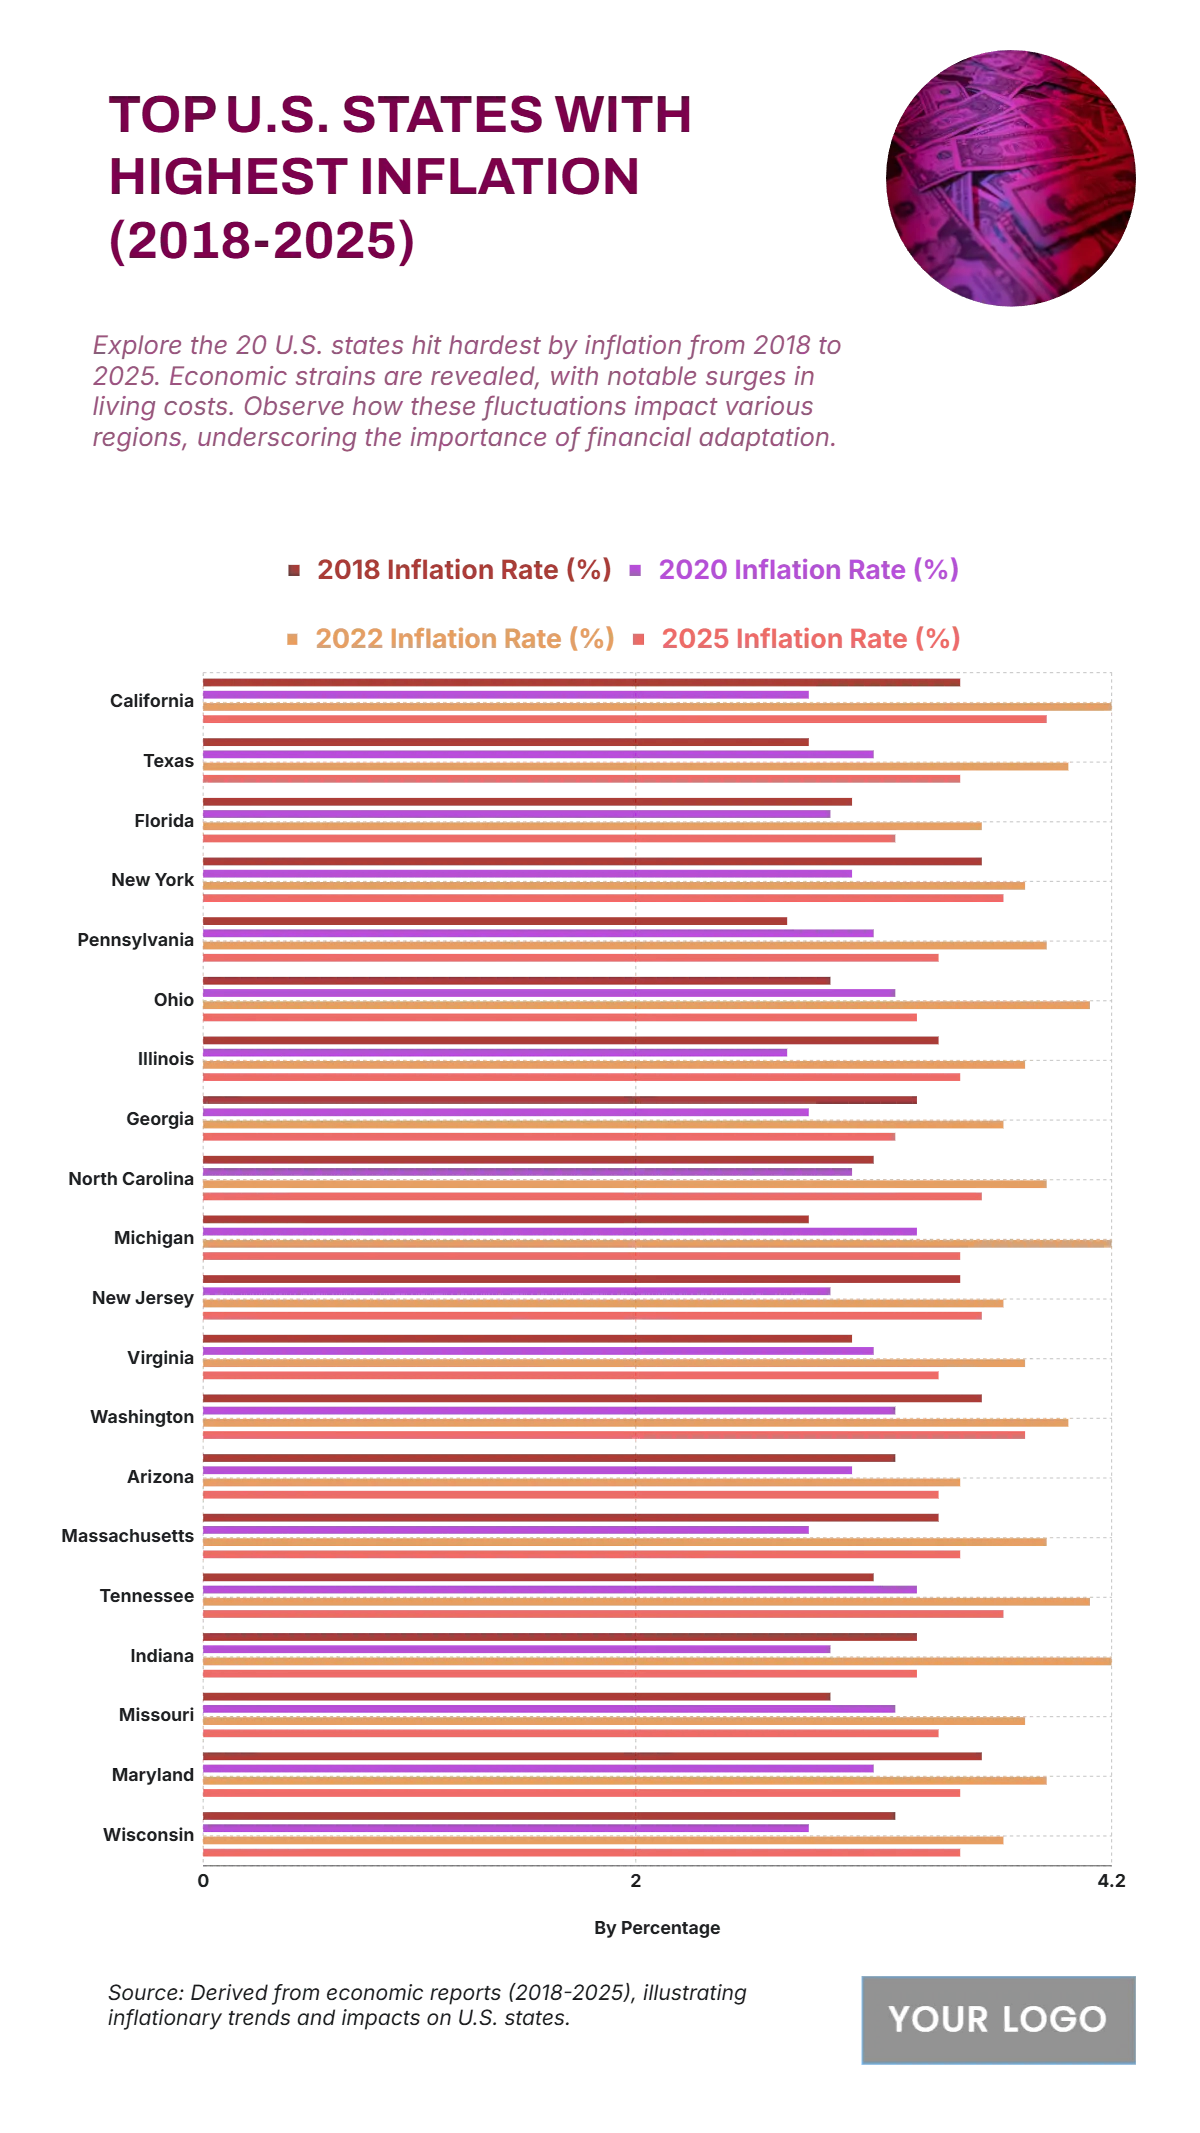
The chart outlines a clear trend of inflation fluctuations between 2018 and 2025, with notable peaks occurring in 2022 across most states. California shows the highest surge, jumping from 3.5% in 2018 to 4.2% in 2022, followed by a slight decline to 3.9% in 2025. Texas starts at 2.8% and climbs steadily to 4.0% in 2022, then drops to 3.5%. Florida records a moderate rise from 3.0% to 3.6% before settling at 3.2%, while New York moves from 3.6% to 3.8%. States like Michigan and Tennessee also peak at 4.2% in 2022, highlighting the inflationary pressure during that period. Meanwhile, Washington maintains one of the highest trajectories, reaching 4.0%, while others like Indiana, Missouri, and Wisconsin experience smaller but consistent increases, ending at around 3.5%. This pattern underscores how inflation surged sharply in the early 2020s before slightly easing by 2025.
| Labels | 2018 Inflation Rate (%) | 2020 Inflation Rate (%) | 2022 Inflation Rate (%) | 2025 Inflation Rate (%) |
|---|---|---|---|---|
| California | 3.5 | 2.8 | 4.2 | 3.9 |
| Texas | 2.8 | 3.1 | 4.0 | 3.5 |
| Florida | 3.0 | 2.9 | 3.6 | 3.2 |
| New York | 3.6 | 3.0 | 3.8 | 3.7 |
| Pennsylvania | 2.7 | 3.1 | 3.9 | 3.4 |
| Ohio | 2.9 | 3.2 | 4.1 | 3.5 |
| Illinois | 3.4 | 2.7 | 3.8 | 3.5 |
| Georgia | 3.3 | 2.8 | 3.7 | 3.2 |
| North Carolina | 3.1 | 3.0 | 3.9 | 3.6 |
| Michigan | 2.8 | 3.3 | 4.2 | 3.5 |
| New Jersey | 3.5 | 2.9 | 3.7 | 3.6 |
| Virginia | 3.0 | 3.1 | 3.8 | 3.4 |
| Washington | 3.6 | 3.2 | 4.0 | 3.8 |
| Arizona | 3.2 | 3.0 | 3.5 | 3.4 |
| Massachusetts | 3.4 | 2.8 | 3.9 | 3.5 |
| Tennessee | 3.1 | 3.3 | 4.1 | 3.7 |
| Indiana | 3.3 | 2.9 | 4.2 | 3.6 |
| Missouri | 2.9 | 3.2 | 3.8 | 3.4 |
| Maryland | 3.6 | 3.1 | 3.9 | 3.5 |
| Wisconsin | 3.2 | 2.8 | 3.7 | 3.5 |


