Free Top 10 U.S. States by Per Capita Retail Sales Growth (2015-2025)
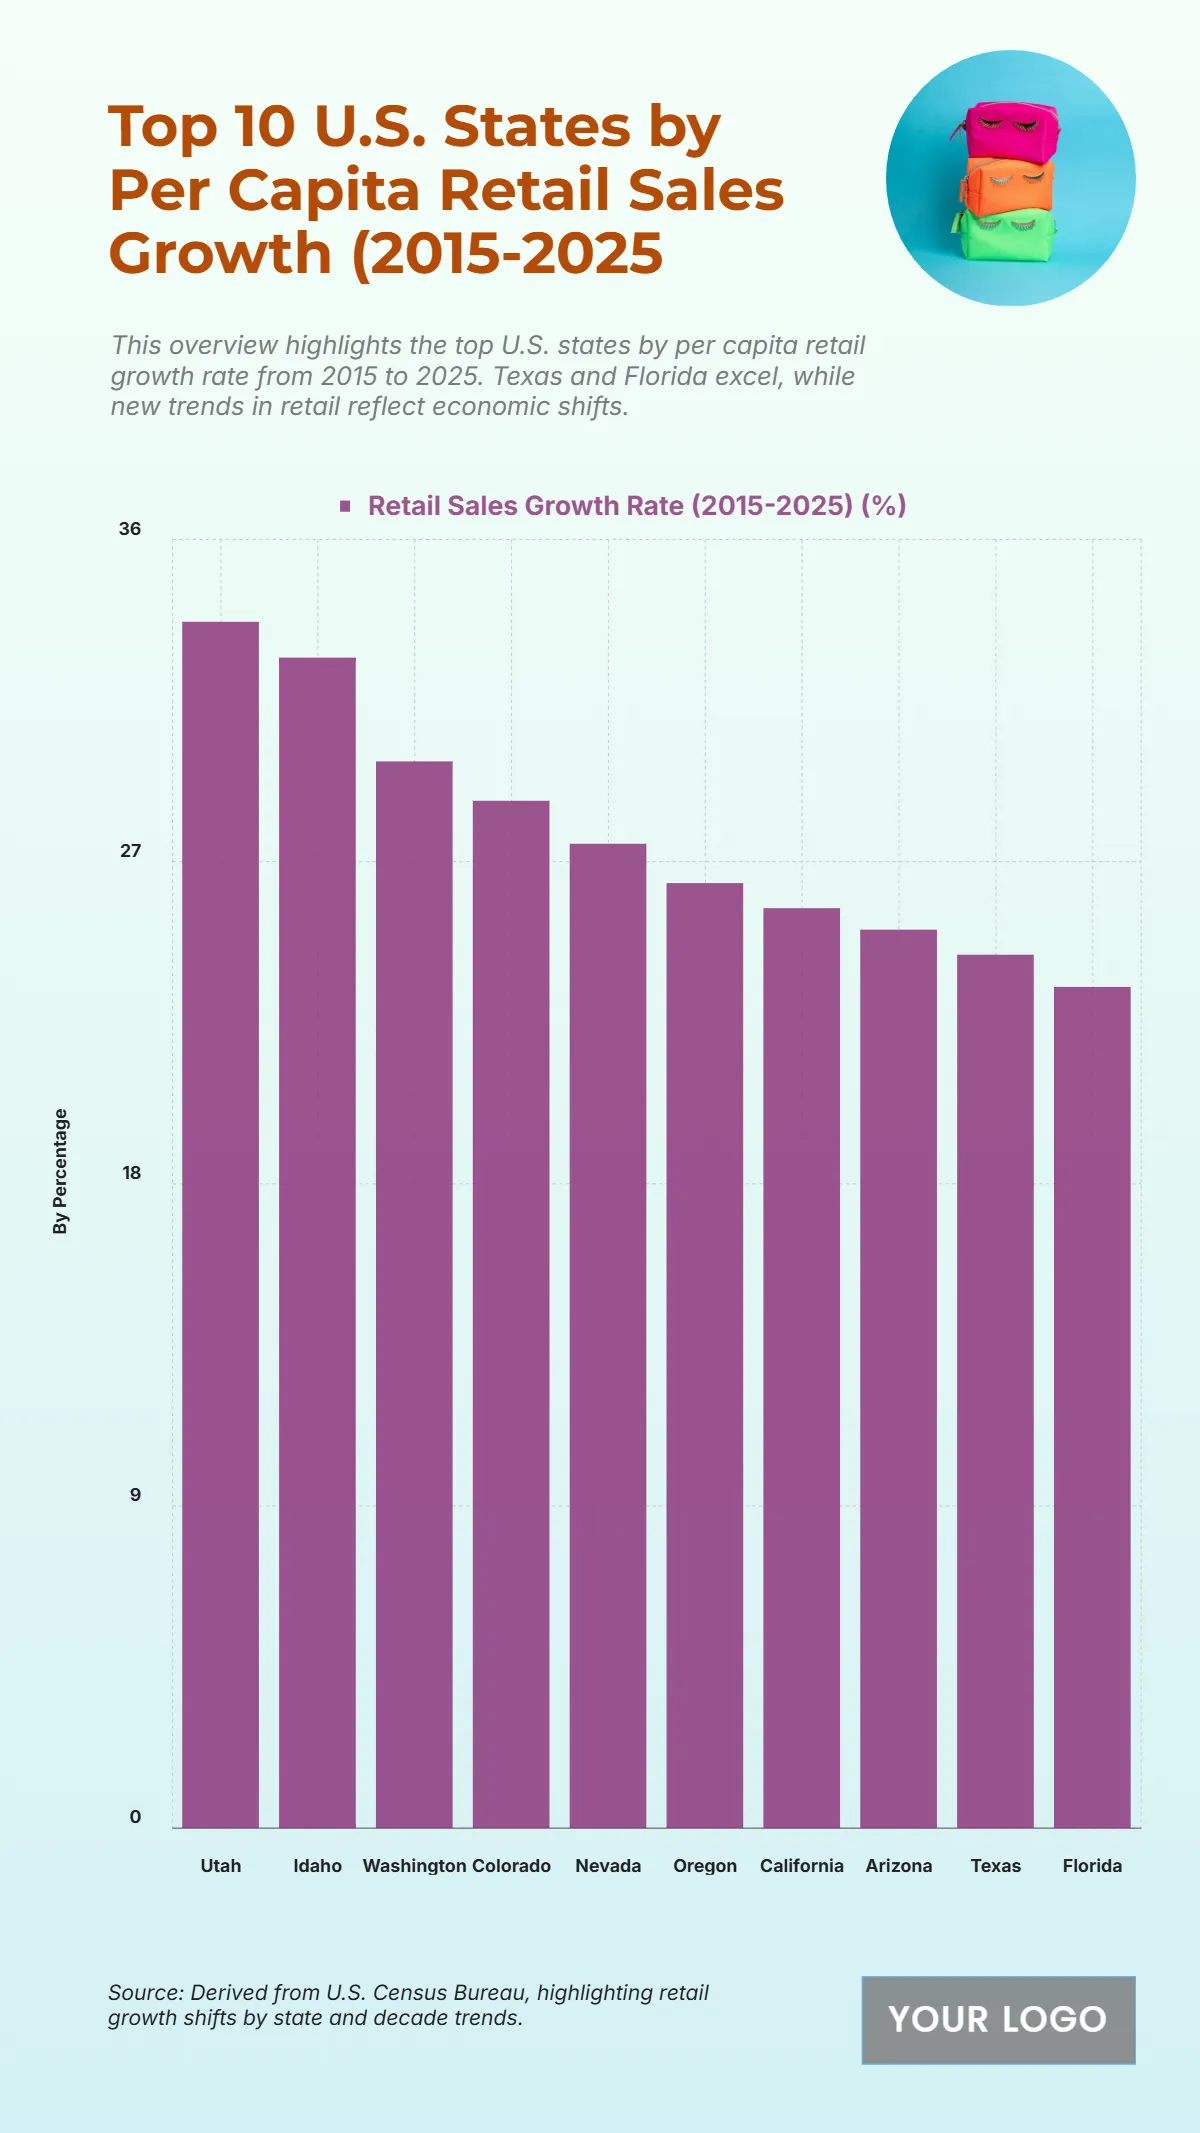
The chart shows that Utah leads in per capita retail sales growth with an impressive 33.7% increase from 2015 to 2025, reflecting strong consumer activity and economic expansion in the state. Idaho closely follows with 32.7%, showcasing similar robust growth trends. Washington records 29.8%, while Colorado stands at 28.7%, emphasizing steady gains in retail performance. Nevada reaches 27.5%, driven by tourism and local spending. Oregon and California also show significant growth rates of 26.4% and 25.7%, respectively, signaling consistent retail development. Arizona follows at 25.1%, with Texas at 24.4% and Florida at 23.5%, rounding out the top ten states. The overall data indicates widespread retail expansion across the western and southern U.S., highlighting regions with dynamic consumer markets and economic resilience over the decade.
| Labels | Retail Sales Growth Rate (2015–2025) (%) |
|---|---|
| Utah | 33.7 |
| Idaho | 32.7 |
| Washington | 29.8 |
| Colorado | 28.7 |
| Nevada | 27.5 |
| Oregon | 26.4 |
| California | 25.7 |
| Arizona | 25.1 |
| Texas | 24.4 |
| Florida | 23.5 |


