Free Top 20 U.S. States by Change in Housing Foreclosure Filings (2018-2025)
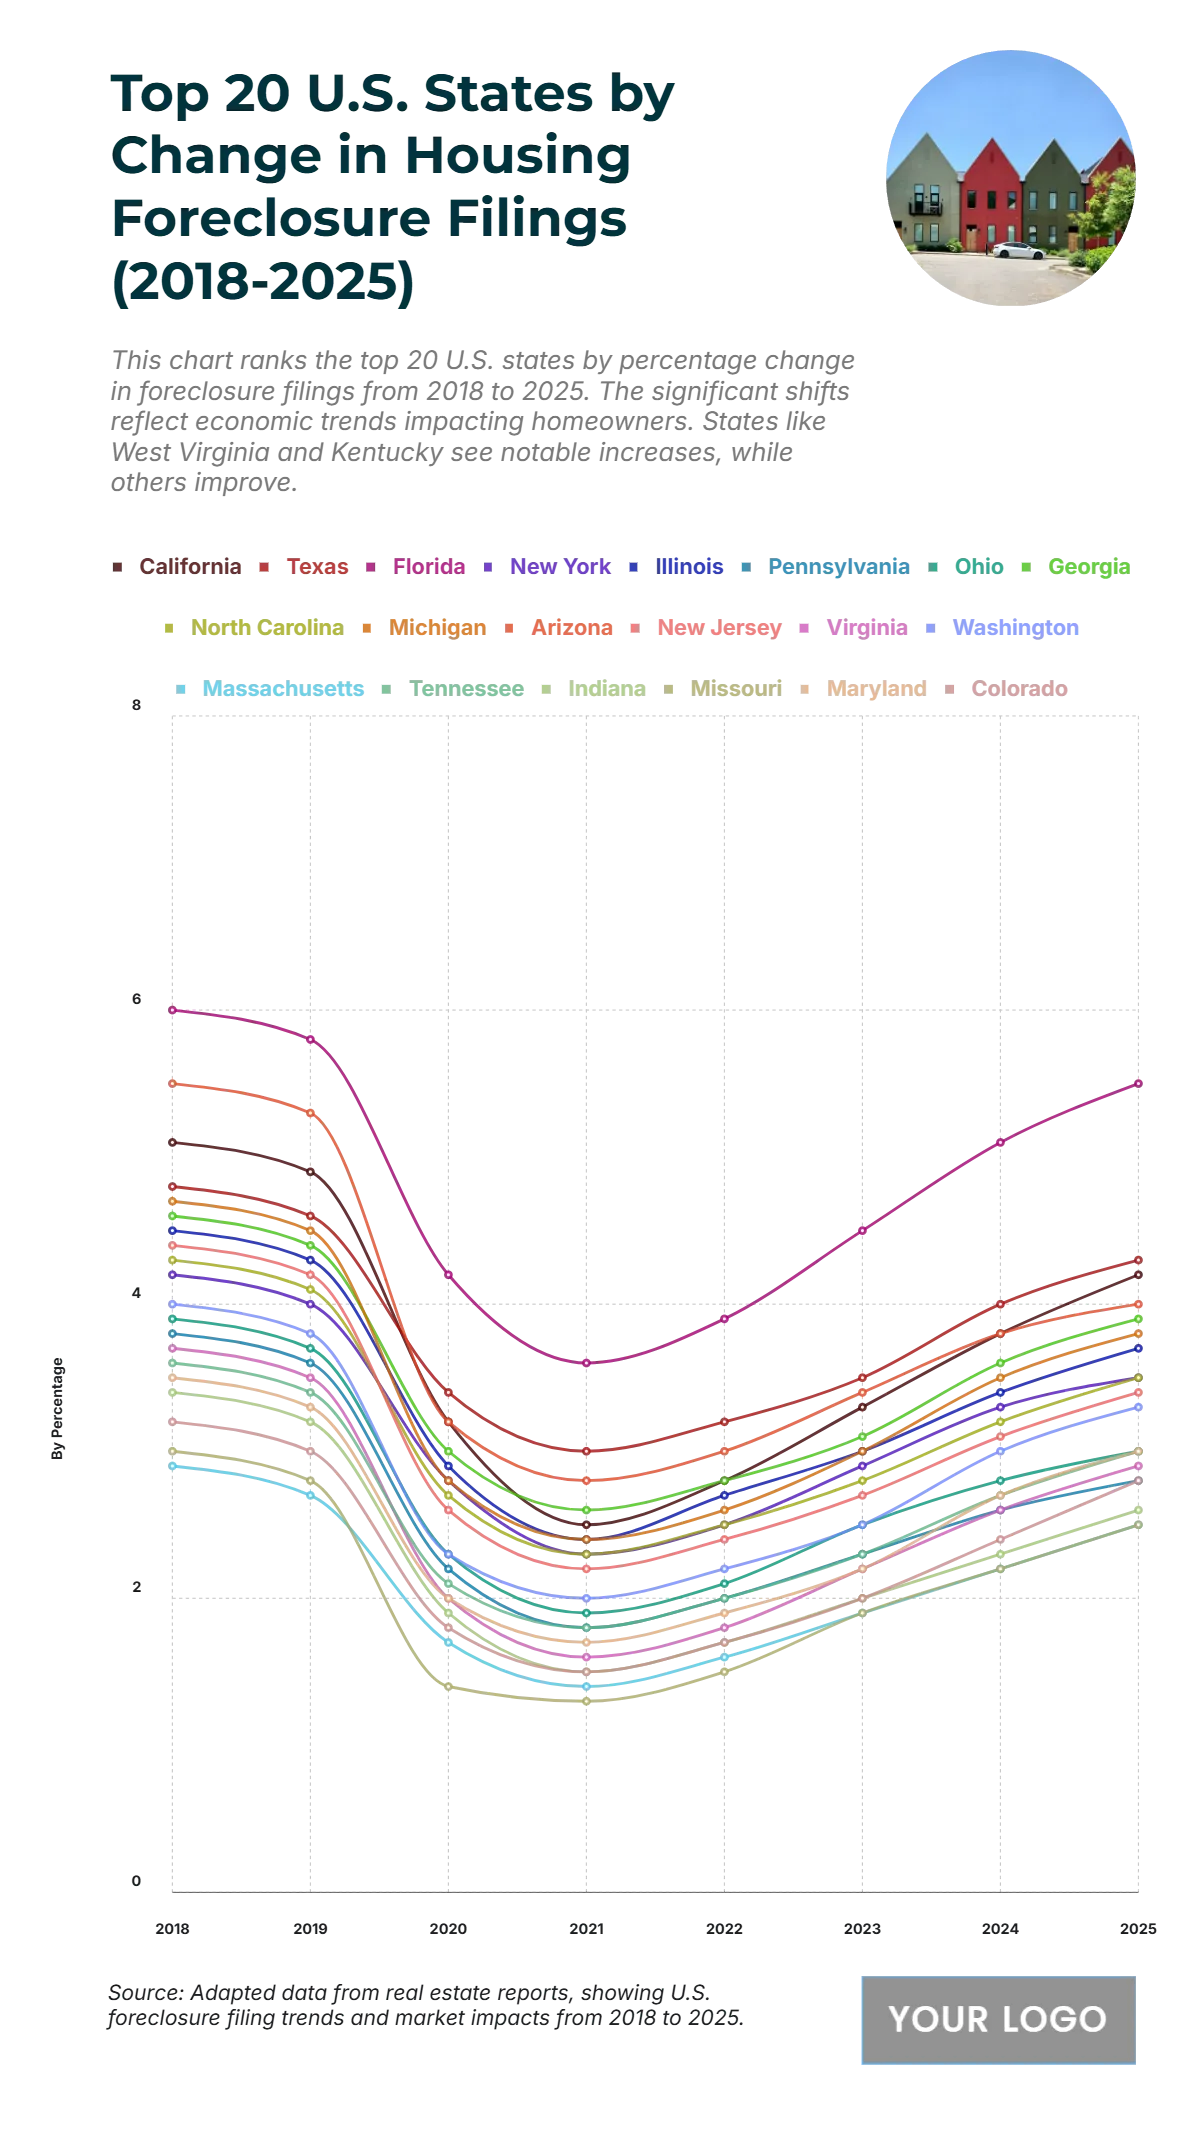
The chart shows that foreclosure filings experienced notable shifts from 2018 to 2025 across multiple states, with Florida having the highest rate at 6.0% in 2018 before dipping to 3.6% in 2021 and rising again to 5.5% by 2025. California followed a similar pattern, declining from 5.1% in 2018 to 2.5% in 2021 and rebounding to 4.2% in 2025. Texas decreased from 4.8% to 3.0% before climbing back to 4.3%. Other states like New York (from 4.2% to 2.3%, up to 3.5%) and Illinois (from 4.5% to 2.4%, up to 3.7%) show similar trends. Michigan and Arizona also saw significant declines mid-period before recovery to 3.8% and 4.0%, respectively, in 2025. States with lower initial rates like Indiana, Maryland, and Colorado showed more gradual changes but followed the same downward-then-upward trajectory. These patterns highlight a broad national trend of temporary foreclosure relief followed by gradual increases toward 2025.
| Labels | 2018 | 2019 | 2020 | 2021 | 2022 | 2023 | 2024 | 2025 |
|---|---|---|---|---|---|---|---|---|
| California | 5.1 | 4.9 | 3.2 | 2.5 | 2.8 | 3.3 | 3.8 | 4.2 |
| Texas | 4.8 | 4.6 | 3.4 | 3.0 | 3.2 | 3.5 | 4.0 | 4.3 |
| Florida | 6.0 | 5.8 | 4.2 | 3.6 | 3.9 | 4.5 | 5.1 | 5.5 |
| New York | 4.2 | 4.0 | 2.8 | 2.3 | 2.5 | 2.9 | 3.3 | 3.5 |
| Illinois | 4.5 | 4.3 | 2.9 | 2.4 | 2.7 | 3.0 | 3.4 | 3.7 |
| Pennsylvania | 3.8 | 3.6 | 2.2 | 1.8 | 2.0 | 2.3 | 2.6 | 2.8 |
| Ohio | 3.9 | 3.7 | 2.3 | 1.9 | 2.1 | 2.5 | 2.8 | 3.0 |
| Georgia | 4.6 | 4.4 | 2.6 | 2.6 | 2.8 | 3.1 | 3.6 | 3.9 |
| North Carolina | 4.3 | 4.1 | 2.7 | 2.5 | 2.8 | 3.3 | 3.5 | 3.8 |
| Michigan | 4.7 | 4.5 | 2.8 | 2.6 | 3.0 | 3.5 | 3.8 | 3.8 |
| Arizona | 5.5 | 5.3 | 3.2 | 2.8 | 3.4 | 3.8 | 4.0 | 4.0 |
| New Jersey | 4.4 | 4.2 | 2.6 | 2.2 | 2.7 | 3.1 | 3.4 | 3.4 |
| Virginia | 3.7 | 3.5 | 2.0 | 1.6 | 2.2 | 2.5 | 2.9 | 2.9 |
| Washington | 4.0 | 3.8 | 2.3 | 2.0 | 2.5 | 3.0 | 3.3 | 3.3 |
| Massachusetts | 2.9 | 2.7 | 1.7 | 1.4 | 1.6 | 1.9 | 2.5 | 2.5 |
| Tennessee | 3.6 | 3.4 | 2.1 | 1.8 | 2.0 | 2.3 | 3.0 | 3.0 |
| Indiana | 3.4 | 3.2 | 1.9 | 1.5 | 1.7 | 2.0 | 2.3 | 2.6 |
| Missouri | 3.0 | 2.8 | 1.4 | 1.3 | 1.5 | 1.9 | 2.5 | 2.5 |
| Maryland | 3.5 | 3.3 | 2.0 | 1.7 | 1.9 | 2.2 | 3.0 | 3.0 |
| Colorado | 3.2 | 3.0 | 1.8 | 1.5 | 1.7 | 2.0 | 2.4 | 2.8 |


