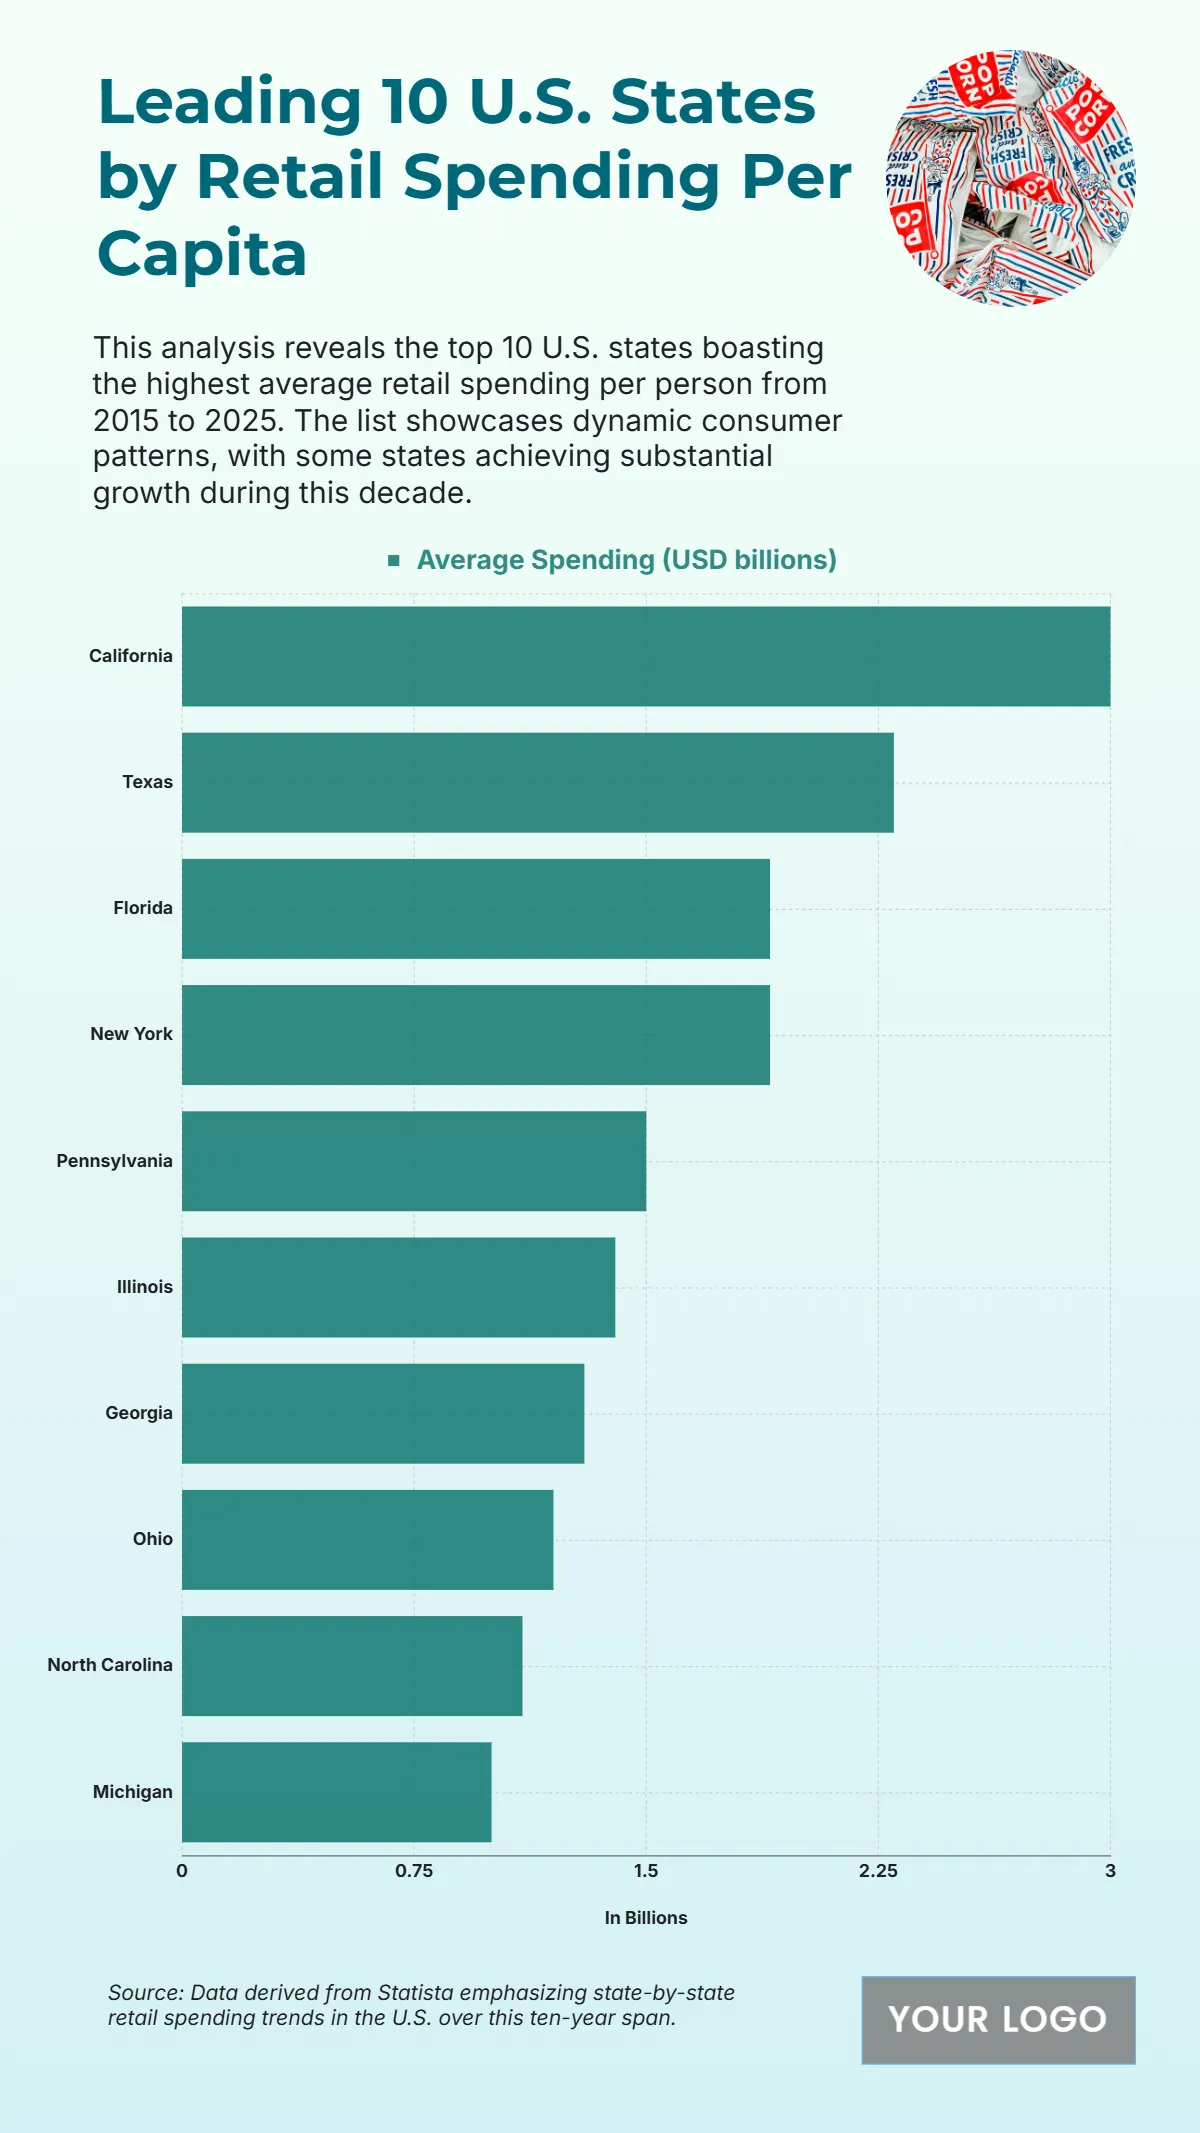
Free Top 10 U.S. States by Per Capita Retail Spending (2015-2025)
The chart shows that District of Columbia records the highest projected retail spending per capita in 2025 at $20.3 billion, signaling a strong consumer market. Massachusetts follows with $16.9 billion, reflecting significant purchasing power. Connecticut stands at $14.8 billion, demonstrating stable retail activity, while New York closely follows with $14.2 billion, supported by its dense consumer population. Maryland shows $13.5 billion, indicating consistent economic performance, while New Jersey posts $12.5 billion, representing solid consumer confidence. New Hampshire holds $11.5 billion, marking steady spending, and California reaches $11 billion, showcasing balanced growth in retail expenditures. Washington follows at $10.5 billion, and Colorado rounds out the list with $10 billion, highlighting its expanding retail sector. These figures illustrate a concentration of spending in both urban centers and high-income states, underlining economic diversity and strong consumer markets across the U.S.
| State/Region | 2025 (Projected, USD billions) |
|---|---|
| District of Columbia | 20.3 |
| Massachusetts | 16.9 |
| Connecticut | 14.8 |
| New York | 14.2 |
| Maryland | 13.5 |
| New Jersey | 12.5 |
| New Hampshire | 11.5 |
| California | 11.0 |
| Washington | 10.5 |
| Colorado | 10.0 |


