Free Top 20 U.S. States with the Most Significant Income Inequality (2020-2025)
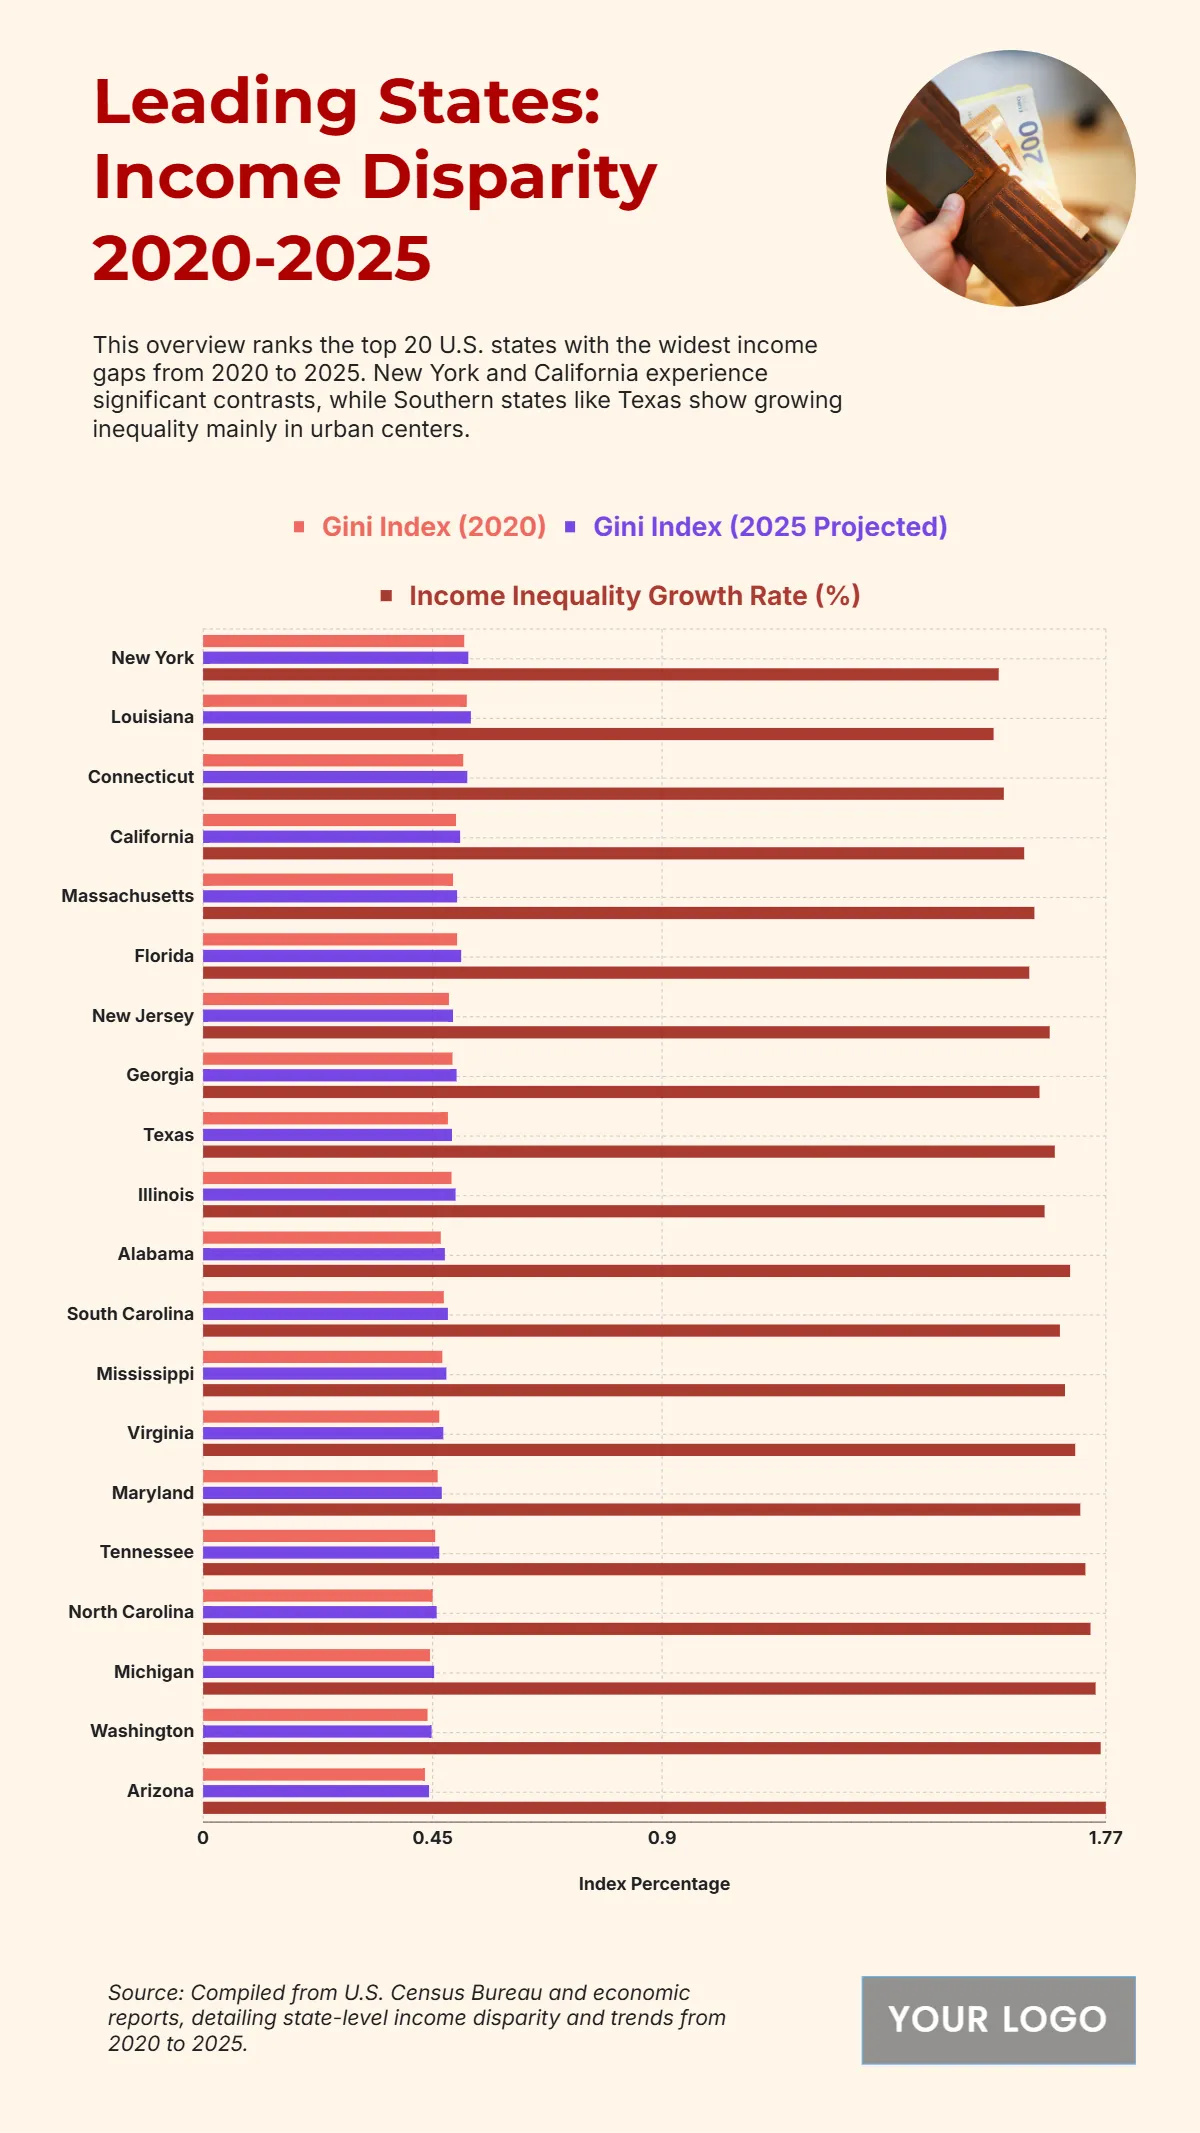
The chart shows widening income inequality across several U.S. states from 2020 to 2025, with New York projected to have the highest Gini Index at 0.52 and an income inequality growth rate of 1.56%. Louisiana follows with a Gini Index of 0.525 and growth of 1.55%, while Connecticut records 0.518 with a 1.57% increase. California reaches 0.504 and Massachusetts 0.498, both reflecting steady rises in inequality. Florida sits at 0.506, while New Jersey, Georgia, and Texas show similar upward patterns between 0.488 and 0.497. Southern states like Alabama, South Carolina, and Mississippi project Gini levels around 0.474–0.48 with higher growth rates of 1.68–1.7%. Notably, states with lower inequality in 2020, including Arizona (0.443) and Washington (0.448), are forecasted to see the largest increases, reaching growth rates of up to 1.77%, signaling expanding disparities across regions.
| State/Region | Gini Index (2020) | Gini Index (2025 Projected) | Income Inequality Growth Rate (%) |
|---|---|---|---|
| New York | 0.512 | 0.520 | 1.56 |
| Louisiana | 0.517 | 0.525 | 1.55 |
| Connecticut | 0.510 | 0.518 | 1.57 |
| California | 0.496 | 0.504 | 1.61 |
| Massachusetts | 0.490 | 0.498 | 1.63 |
| Florida | 0.498 | 0.506 | 1.62 |
| New Jersey | 0.482 | 0.490 | 1.66 |
| Georgia | 0.489 | 0.497 | 1.64 |
| Texas | 0.480 | 0.488 | 1.67 |
| Illinois | 0.487 | 0.495 | 1.65 |
| Alabama | 0.466 | 0.474 | 1.70 |
| South Carolina | 0.472 | 0.480 | 1.68 |
| Mississippi | 0.469 | 0.477 | 1.69 |
| Virginia | 0.463 | 0.471 | 1.71 |
| Maryland | 0.460 | 0.468 | 1.72 |
| Tennessee | 0.455 | 0.463 | 1.73 |
| North Carolina | 0.450 | 0.458 | 1.74 |
| Michigan | 0.445 | 0.453 | 1.75 |
| Washington | 0.440 | 0.448 | 1.76 |
| Arizona | 0.435 | 0.443 | 1.77 |


