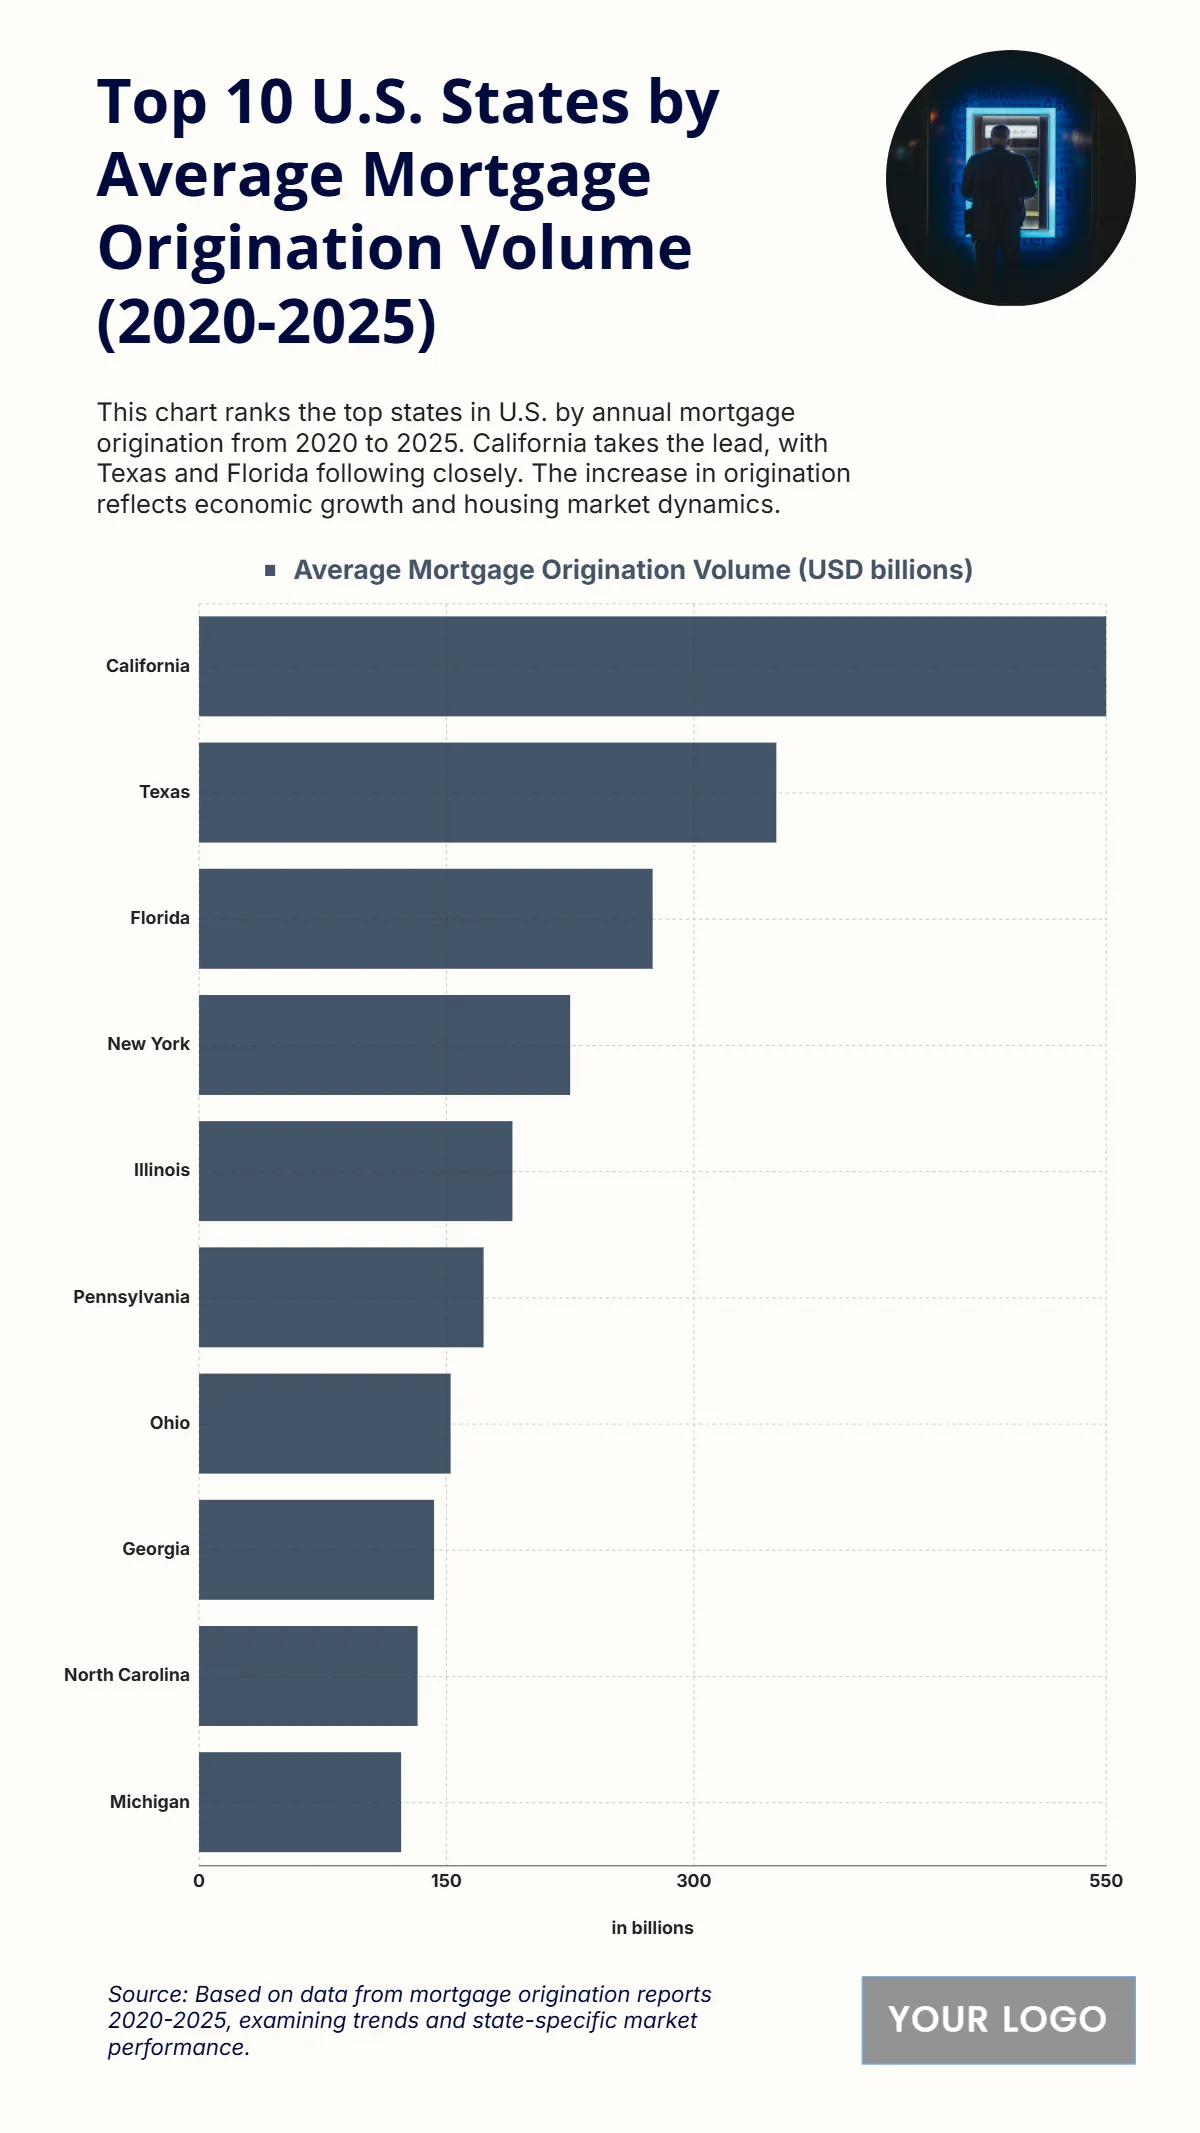
Free Top 10 U.S. States by Average Mortgage Origination Volume (2020-2025) Chart
The chart shows that California leads with the highest average mortgage origination volume between 2020 and 2025 at USD 550 billion, reflecting its strong housing market and economic activity. Texas follows with USD 350 billion, sharing the same figure as Florida, which also records USD 350 billion, indicating significant real estate transactions in these fast-growing states. New York ranks fourth with USD 275 billion, while Illinois records USD 225 billion. Pennsylvania stands at USD 190 billion, followed by Ohio at USD 172.5 billion, highlighting active housing markets in these regions. The lower half includes Georgia with USD 152.5 billion, North Carolina with USD 142.5 billion, and Michigan with USD 132.5 billion, reflecting solid but less dominant mortgage origination compared to top states. These figures emphasize the concentration of mortgage activity in major economic hubs.
| Labels | Average Mortgage Origination Volume (USD billions) |
|---|---|
| California | 550 |
| Texas | 350 |
| Florida | 350 |
| New York | 275 |
| Illinois | 225 |
| Pennsylvania | 190 |
| Ohio | 172.5 |
| Georgia | 152.5 |
| North Carolina | 142.5 |
| Michigan | 132.5 |


