Free U.S. Top 20 States by State-Level Public Debt (2018-2025) Chart
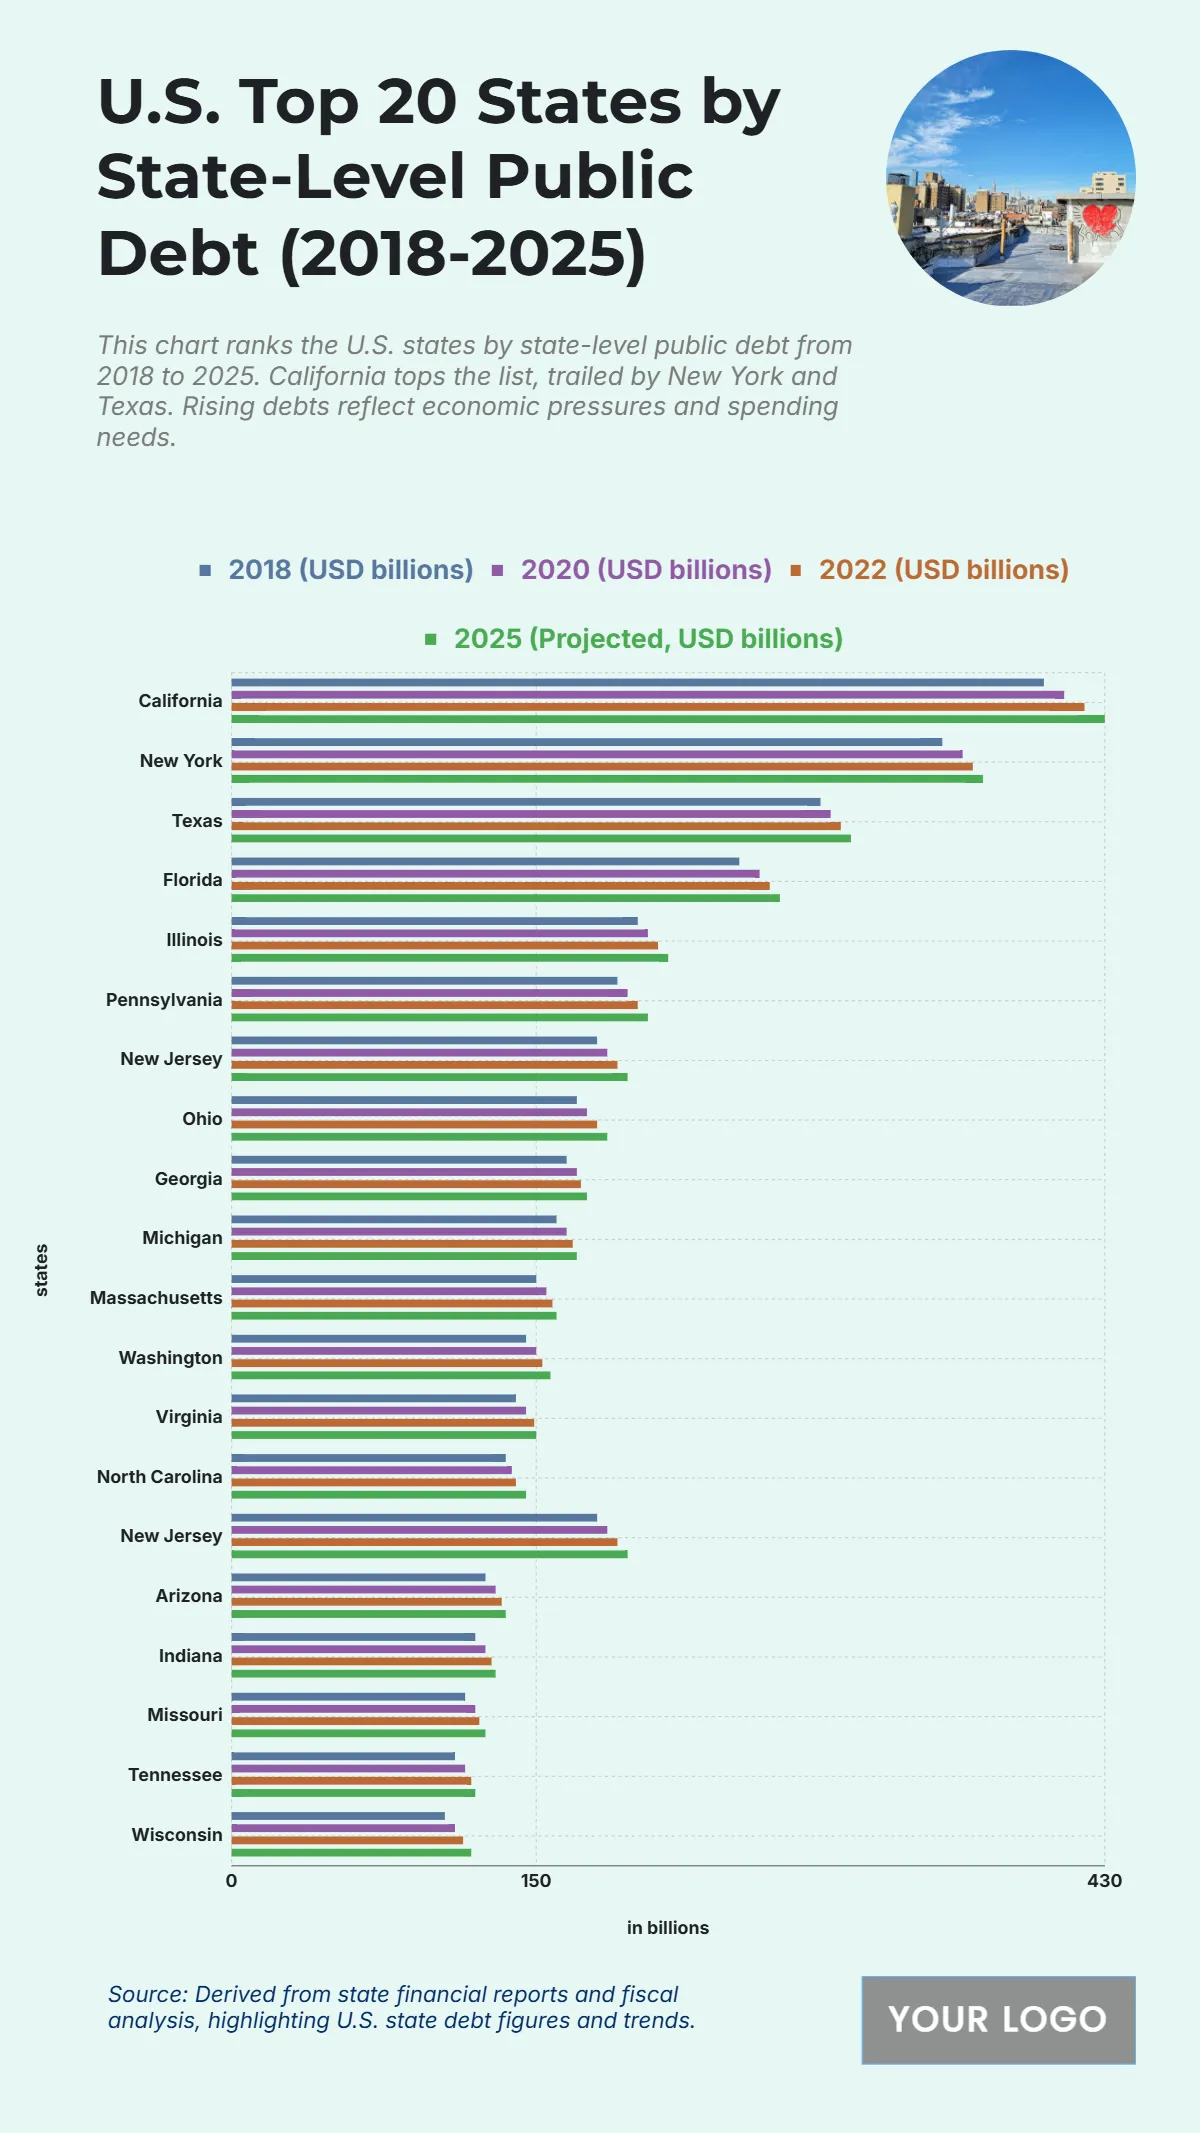
The chart shows that California consistently records the highest state-level public debt, increasing from USD 400 billion in 2018 to a projected USD 430 billion by 2025, highlighting ongoing economic pressures and spending demands. New York follows with an increase from USD 350 billion to USD 370 billion over the same period, while Texas rises from USD 290 billion to USD 305 billion, maintaining its strong position. Florida grows from USD 250 billion to 270 billion, and Illinois shows moderate growth from USD 200 billion to 215 billion. Pennsylvania, New Jersey, and Ohio also exhibit steady increases, reaching USD 205 billion, 195 billion, and 185 billion respectively in 2025. Meanwhile, states such as Georgia, Michigan, Massachusetts, and Washington report smaller yet consistent increases. Overall, this upward trend underscores widespread fiscal expansion across top states.
| Labels | 2018 (USD billions) | 2020 (USD billions) | 2022 (USD billions) | 2025 (Projected, USD billions) |
|---|---|---|---|---|
| California | 400 | 410 | 420 | 430 |
| New York | 350 | 360 | 365 | 370 |
| Texas | 290 | 295 | 300 | 305 |
| Florida | 250 | 260 | 265 | 270 |
| Illinois | 200 | 205 | 210 | 215 |
| Pennsylvania | 190 | 195 | 200 | 205 |
| New Jersey | 180 | 185 | 190 | 195 |
| Ohio | 170 | 175 | 180 | 185 |
| Georgia | 165 | 170 | 172 | 175 |
| Michigan | 160 | 165 | 168 | 170 |
| Massachusetts | 150 | 155 | 158 | 160 |
| Washington | 145 | 150 | 153 | 157 |
| Virginia | 140 | 145 | 149 | 150 |
| North Carolina | 135 | 138 | 140 | 145 |
| New Jersey | 180 | 185 | 190 | 195 |


